Implied volatility is the single most important number in options trading — and the most misunderstood. I check the IV level of an underlying before I look at its price chart. Every entry decision in my account, every strategy selection, every adjustment trigger is filtered through an IV lens first. Here's everything you need to understand it the way a professional does.
Implied volatility is not Historical volatility
Being an options trader, you need to understand both concepts regarding volatility: historical volatility and implied volatility.
Historical volatility is defined as “the annualized standard deviation of past stock price movements.”. In essence, this shows how much the stock price fluctuated on a day-to-day basis over a one-year period. So, the thing to remember is that historical volatility reflects the price movements of a particular stock.
On the contrary, Implied volatility isn’t based on stock price movement. Instead, it’s what the market participants are “implying” about the stock volatility will be in the future. This is based on the premium (or price of an option) of its options. Based on the news in the market, option prices will begin to change like stock also moves. For example, one event that drives up the implied volatility and consequently options premium (or prices) is an earnings announcement. This is independent of stock price movement.
Both historical and implied volatility is expressed on an annualized basis. But implied volatility is the value to focus on to any option trader because this is the basis of the premium (or price) to pay for a particular option (Call or Put).
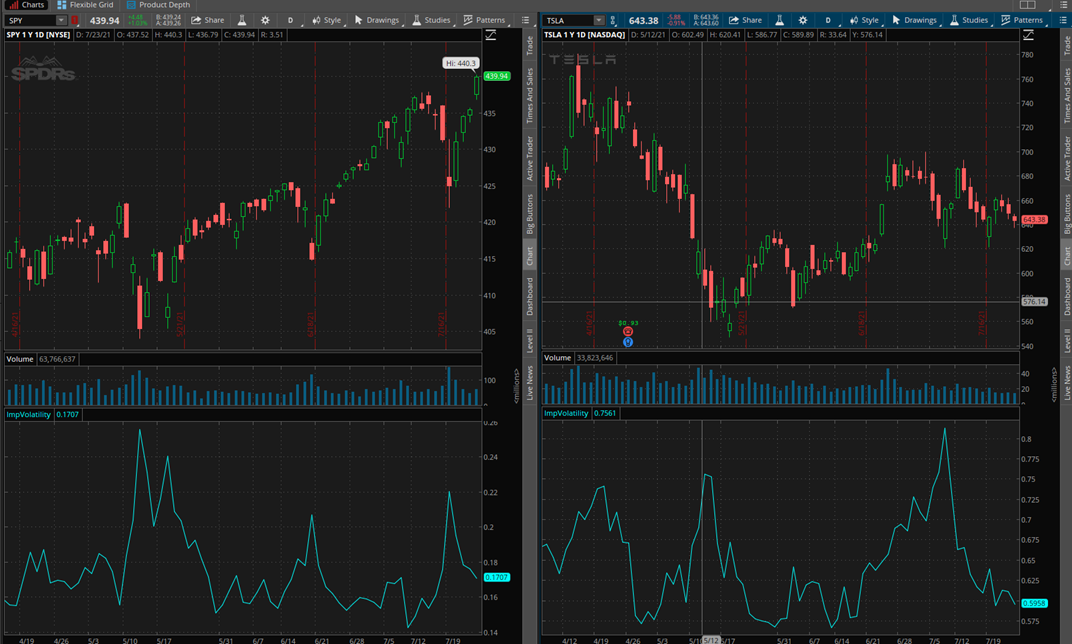
Compare both charts for SPY and TSLA is a given period. In the below chart of each (light blue line), you can see the implied volatility chart.
Implied Volatility trading implications
Before entering into details about Implied Volatility (or IV) and its huge relevance on options trading, I would like to point out that, I base all my strategies (entry and exit points) dependent on Delta values than on stock or ETFs price movements (or price points). This is because Delta also varies with IV (and time, quote position, etc). My strategies are based on probabilities and when applied will adapt to each moment's market conditions! So, when I open a trade with at a 30 Delta Call in a low IV environment, probably this means a 3% move from the actual price. But, maintaining the same strategy in a high volatility environment, could mean an 8% move or more! As you can conclude, when dealing with options it is better to think about probabilities than of percentage price move! What I mean is, if you sell a Put 10% OTM (Out-the-money) because you expect to collect a premium due to the stock move higher or staying at the current level it does not mean anything to me if I cannot understand if that stock is low or high volatile. If you tell me that you are selling Put at -10 Delta, this has a different meaning to me! It does not matter, in this case, if a stock is high or low IV… you sell a Put to collect premium with an average chance of 90% of the options expiring worthless at expiration.
What is Implied Volatility?
When you trade stocks, only price variation enters into the equation because if you are expecting it to move up, you simply buy the stock (or short the stock if you expect it to move down). When dealing with options, many factors will impact its price. The Implied Volatility (or “IV”) is the main driver that impacts the value of the option. When you take a long position in a stock you expect it will increase in price. When you have a net long position in options you expect its Implied Volatility is low and expect its IV will increase in the future (well, there are other factors involved, but in a simple way, this is what to expect). So, like in stocks, “Sell High and Buy Low” also applies but for IV in Options! We need to select the options strategies to apply and we should take the IV level into account! In fact, I check more often the IV level of a Stock than its price chart (I am an options trader; not a stock trader!).
Implied volatility (IV) is determined by the current price of options contracts on a particular stock, ETF, or future. Its value is a percentage that indicates, at the moment, the annualized expected range of 1 SD (Standard Deviation) for the asset-based on option prices. You can see in Picture 1 that, statistically, one standard deviation will encompass approximately 68.2% of outcomes in a sample. When it comes to Implied Volatility, one standard deviation means that there is approximately a 68% probability of an asset settling within the expected range as determined by options prices.

In picture 2 there are two curves that illustrate two assets under different levels of IV. By means of comparison, if both assets have a similar price, the options prices will be more expensive on the blue one than the black one.

Implied volatility is a projection by market participants of how much market movement is anticipated for a specific underlying – regardless of the direction. In other words, implied volatility reflects the expected range of potential outcomes and uncertainty around how high or low an underlying asset might rise or fall. High implied volatility indicates there is a greater chance of large price swings expected by traders whereas low implied volatility signals that the market expects price movements to be relatively tame. Implied volatility measurements can also help traders gauge market sentiment considering IV broadly depicts the level of perceived uncertainty – or risk.
Illustration
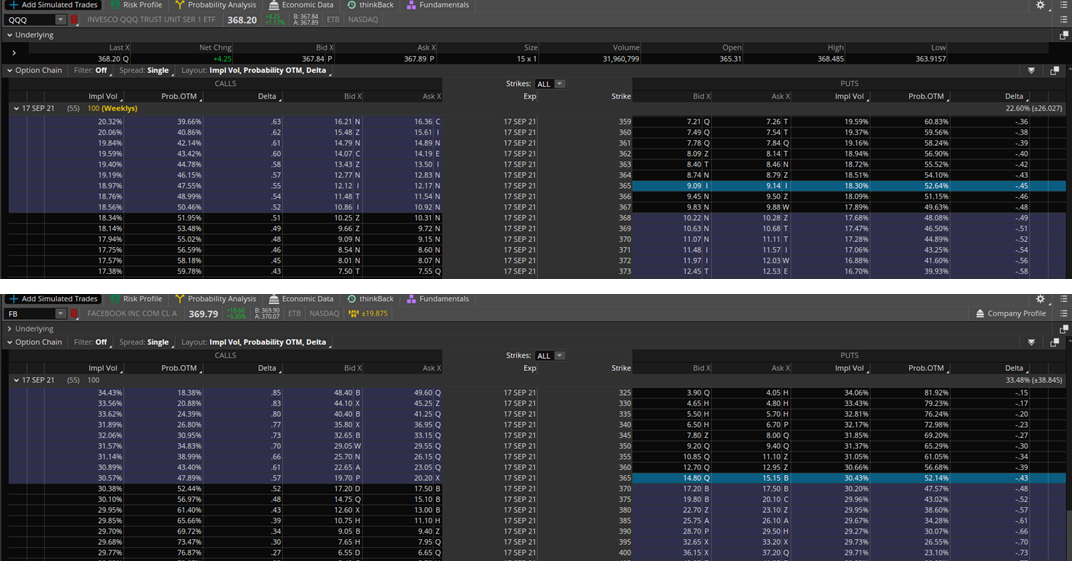
Below you can check the options price of two assets, QQQ and FB, currently at similar stock price (circa 370). You can now see that for an ATM Put at the same expiration where the IV of FB (30,43%) is higher than QQQ (18,30%) and consequently, options prices are much different (9.12 for QQQ and 14.90 for FB).
Example: Impact of IV in a FB Iron Condor
In the following 3 figures taken from thinkorswim platform, you can see an Iron Condor profile on FB (Facebook). The stock at the time of the simulation was at 359.90. For the sake of comparison, the short strikes on the Put and Call sides were entered around 20 Delta and maintained at those strikes.
Figure 1 - Base Case where the Implied Volatility is on average for all strikes around 37%.
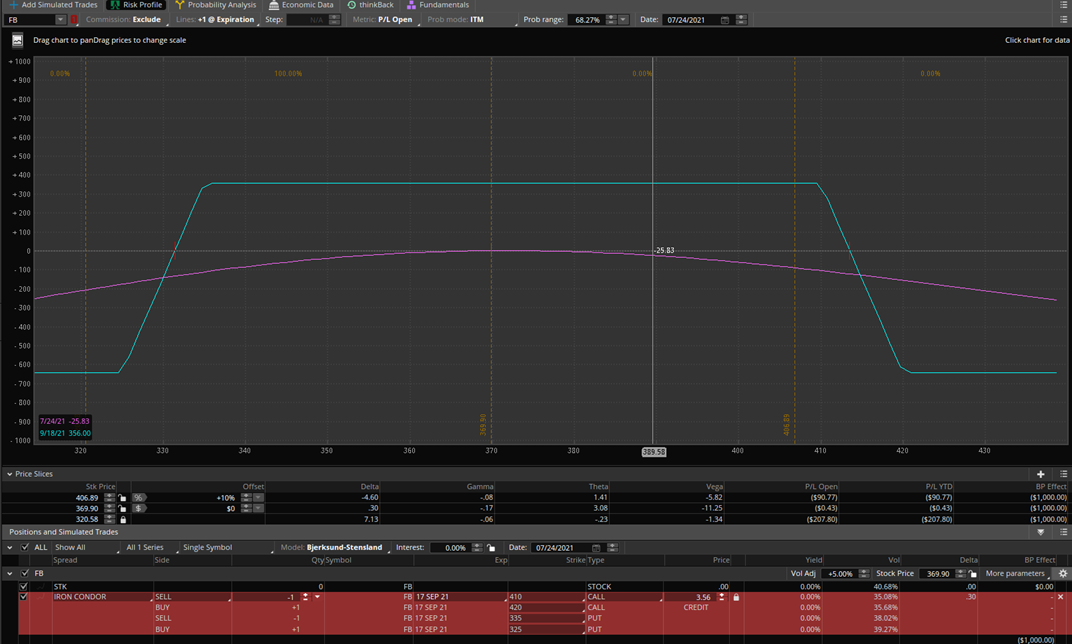
Above you can see that the maximum profit of the Iron Condor is circa $350 for a max loss of roughly $650. This delivers a Risk / reward of 1.85.
Figure 2 - Simulation the options Implied Volatility decrease 5% on average, maintaining all variables constant. And now sits roughly at 32%.

Even though the price of FB did not change, the effect of the reduction of the average implied volatility delivered a profit of $60.80 because the Iron condor is a negative Vega options strategy. So, when you open positions with this strategy the trader expect the IV in the future to drop because it helps. This strategy is best used when IV is high. Remember "Sell High, Buy low". In options are the same but it applies not to the price but the options premium.
In the TSLA chart above, if the trader had entered an Iron Condor at the IV peak (8 Jul), it would be benefiting a lot from the trade because TSLA did not move too much, implied volatility crashed and some time has passed... all good signs of a very nice and profitable Iron Condor trade
Figure 3 - Simulation of the same Iron Condor but in a low implied volatility situation.

Now, it is easy to understand the impact of IV in the Iron Condor options strategy, a Vega negative strategy. In the above structure, under a low IV environment, the maximum profit of the Iron Condor is now circa $225 for a max loss of roughly $775. This delivers a Risk / reward of 3.44! Much riskier than under a high IV environment.
How to calculate Implied Volatility?
Given the IV of each option, we can compute the 1 standard deviation expected range (this will have a 68% chance to happen) for a stock's price after one year:
Expected 1-year range = Stock price * (1+ IV) for the top of the range and Stock price * (1-IV) for range minimum.
For one year's expected moves, simply multiplying the stock price by implied volatility will do. However, for shorter time frames, the expected range calculation must be adjusted with the expiration date. Here is the formula for calculating a stock's one standard deviation move for any time period:
Stock Price * Implied Volatility * SQRT (Calendar Days to Expiration / 365).
In the given example, for QQQ:
368.20 * 18,32% * SQRT (55/365) = 26.15
It means that QQQ can vary +-26.15 in the next 55 days (or 342 to 394)
How to Use Implied Volatility to support your options trading?
As the community members at myoptionsedge know, my most important chart is the implied volatility one. Secondly, I am looking at the "normal" price chart of a particular stock or index. On the charts above of QQQ and TSLA, taken from thinkorswim platform, you can easily see that implied volatility (the blue line below) is moving in cycles, with peaks and lows, but usually around its average.
This is important to take into consideration your options trading decisions because a trader will get an idea of how to determine a relative implied volatility range (or IV Rank). This will help the trader to determine when implied volatility is high or low, relative to its mean in a recent timeframe. If an options trader concludes the IV is relatively high, he might forecast a future drop in implied volatility or a reversion to the mean (or determine if implied volatility is relatively low, he might forecast a possible rise in implied volatility or a reversion to the mean). Implied volatility, like everything else, moves in cycles. High-volatility periods are followed by low-volatility periods and vice versa.
This will impact the strategy to choose. When Implied Volatility is high the trader should choose Vega negative strategies like Iron Condors or Butterflies. This will give an extra edge to the trade because not only Theta (or time decay will be in his favour) but also when IV drops, the trader we gain from the negative Vega position. On the contrary, Strangles or Straddles perform better when opened in a low IV environment. The Calendar spreads work also well under a low IV environment but due to their different expirations, there are other factors to consider. Nevertheless, time decay (positive Theta) is on the trader's side.
Here is the problem with raw implied volatility numbers that most options education never addresses directly.
If I tell you that SPY's current implied volatility is 22%, is that high or low? Should you be selling premium or buying it? Should you open an iron condor or a calendar spread?
You cannot answer any of those questions from the number 22% alone.
Now compare: if I tell you that TSLA's current implied volatility is 22%, the answer changes completely. For TSLA — a stock that regularly swings 5–10% in a single session — an IV of 22% is historically very low. The options are cheap. It's a buyer's environment, not a seller's.
The same number. Completely opposite trading implications.
This is why raw IV is only half the information you need. The other half is IV Rank — and it changes how you interpret every IV reading you see from this point forward.
IV Rank (IVR) solves the contextualisation problem by asking a simple question: where does the current IV sit relative to its own history over the past 52 weeks?
The formula:
IV Rank = (Current IV − 52-Week IV Low) ÷ (52-Week IV High − 52-Week IV Low) × 100
The result is always a number between 0 and 100.
A worked example:
Suppose SPX has the following IV readings over the past year:
52-week IV high: 35% (during a sharp market selloff)
52-week IV low: 12% (during a quiet, low-volatility period)
Current IV: 20%
IV Rank = (20 − 12) ÷ (35 − 12) × 100 = 34.8
An IVR of 35 tells you that current IV is in the lower third of its annual range. In practical terms: IV is below average. Premium is relatively cheap. The environment favours strategies that benefit from IV expansion (positive Vega) rather than IV contraction.
If current IV were 28% instead:
IV Rank = (28 − 12) ÷ (35 − 12) × 100 = 69.6
An IVR of 70 tells you that current IV is in the upper third of its annual range. Premium is elevated. This is the environment that favours premium-selling strategies — iron condors, broken wing butterflies, credit spreads — because you're selling options when they're expensive and collecting more premium for the same structural risk.
IV Rank rangeWhat it meansImplication for premium sellers0–20IV historically very lowThin premium, harder to justify premium selling; calendar spreads and long Vega strategies more attractive20–40IV below averageAcceptable for selective entries; be more conservative with strike placement40–60IV around its averageNeutral environment; standard positioning applies60–80IV elevatedAttractive for premium selling; more credit collected for same structural risk80–100IV historically very highStrong premium-selling environment; but be aware of what's driving the spike — gap risk may be elevated
The key insight embedded in this table: the same options strategy carries completely different risk/reward at IVR 15 versus IVR 75, even if the underlying price, the strikes, and the DTE are identical. The only difference is the IV environment at entry — and that difference shows up directly in how much premium you collect, how wide your breakeven range is, and how much IV contraction can help or hurt you after entry.
These two terms are frequently confused, including by experienced traders. They measure related but different things.
IV Rank (as described above) measures where current IV sits relative to the range of IV over the past year — the distance from the lowest point to the highest point. A single extreme spike can significantly compress or distort the IVR reading because it changes the denominator.
IV Percentile measures what percentage of days over the past year had lower IV than today. If today's IV is higher than 80% of all days in the past year, the IV Percentile is 80.
Which is better? For most practical purposes, IV Rank is more widely used and more directly actionable. However, in markets that have experienced extreme one-off volatility spikes — like the March 2020 COVID selloff or the April 2025 tariff shock — IV Rank can be misleading because the extreme high resets the scale, making everything look low by comparison. In those cases, IV Percentile gives a more stable reading.
I check both. But for initial entry decisions on the SPX Best and Ride Trade, IV Rank is my primary filter.
This is the part most IV guides don't include: the specific numbers actually used in live trading decisions.
For the SPX Best (broken wing butterfly on SPX puts):
I open new positions across a wide range of IV environments because the structure is designed to be resilient. However, the aggressiveness of positioning changes with IVR:
IVR below 20: I open positions but place the short strikes further from the current price than usual — the premium is thinner, so the risk/reward only works with more structural distance. I also size positions slightly smaller.
IVR 20–50: Standard positioning. The SPX Best's target credit and strike placement apply normally.
IVR above 50: Attractive entry. More premium collected, wider profitable range, and the Vega negative structure benefits from subsequent IV contraction. I may open positions more aggressively — slightly closer short strikes to collect maximum credit.
For the Ride Trade (calendar spread on SPY):
The Ride Trade is Vega positive — it benefits from IV expansion. This makes it the natural complement to the SPX Best across IV environments:
IVR below 25: Ideal for the Ride Trade. Entering at low IV means the calendar spread costs less to open and the position benefits if IV subsequently increases — which is the natural reversion-to-mean tendency after historically low IV periods.
IVR above 50: I prefer to reduce Ride Trade exposure and increase SPX Best exposure, since high IV favours Vega negative positions. The Ride Trade can still work at elevated IV but the entry cost is higher and the potential IV contraction works against it.
Thinkorswim (Charles Schwab): The easiest platform for IV Rank monitoring. In the Trade tab, the IV Rank and IV Percentile columns can be added to any watchlist. Alternatively, the "Today's Options Statistics" gadget at the bottom of the chart window shows both metrics for any underlying you're viewing.
I also make the IV Rank indicator code for ThinkorSwim available to the community — if you'd like it, email pedro.branco@myoptionsedge.com and I'll send it directly.
Tastytrade: IV Rank is displayed prominently on every options chain as "IVR" — one of the reasons tastytrade is popular among premium sellers. It's visible without any setup required.
Options Scanners: Sites like Market Chameleon and barchart.com provide IV Rank screens that let you filter for underlyings above or below specific IVR thresholds — useful for identifying potential trade candidates across multiple instruments simultaneously.
1. Historical volatility is not correlated with Implied Volatility;
2. Implied volatility is the key measure for options traders;
3. Implied Volatility measures how much an underlying price is likely to move up or down in a specific period of time (from the perspective of the options market)
4. When earnings announcement approaches, it is likely that implied volatility increases despite price movement
5. The implied volatility level impacts the options strategies to choose when opening a trade