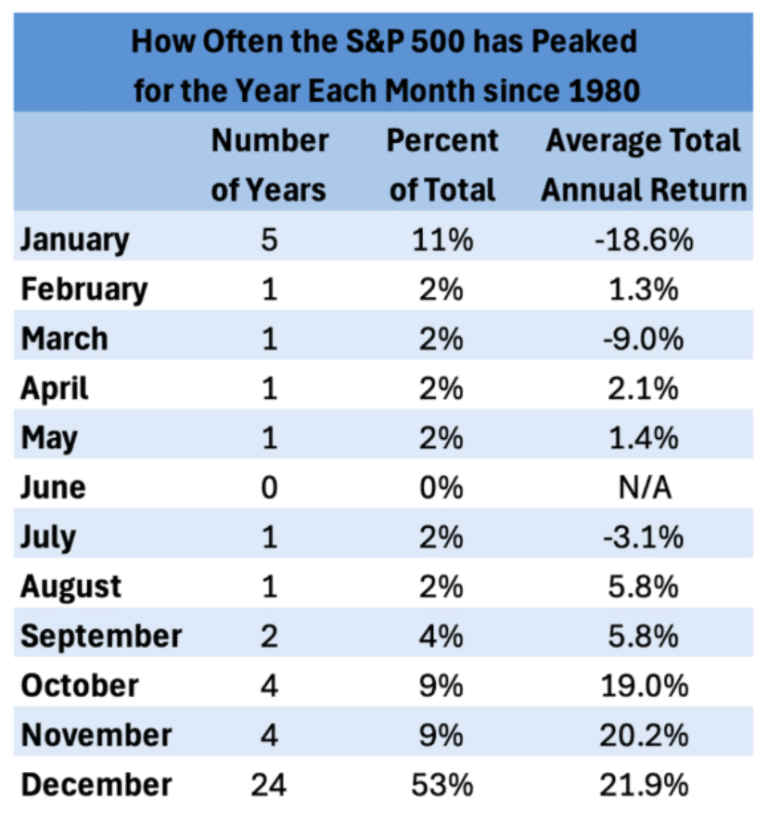
A. Market Outlook — my probability-weighted scenarios for the week ahead with specific SPX price targets, VIX level forecasts, and strategy recommendations. Plus a "Bigger Picture" section showing the key seasonal and quant signals shaping my overall view for the year-end.
B. Account Performance — the account's current NetLiq value, YTD return, and since-inception performance vs SPX. Every open position is listed with its structure and expiration. Portfolio Greeks (Delta, Theta, Vega) updated weekly.
C. S&P Quant Research — institutional-grade seasonal and statistical data: historical pattern analysis, forward return tables, and the specific quant signals that inform the fund's directional bias.
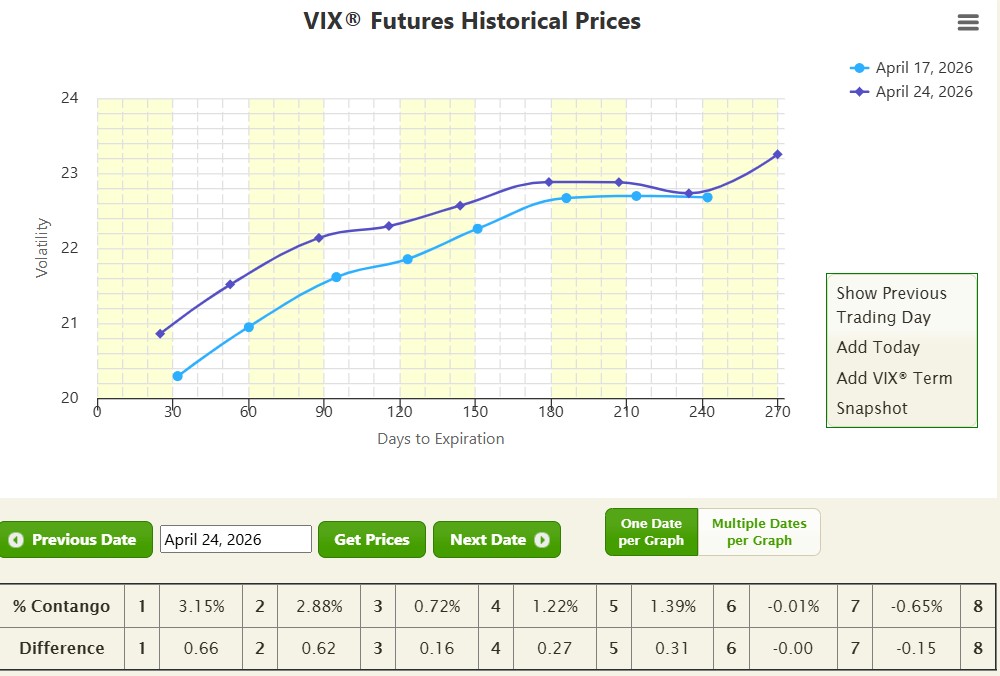
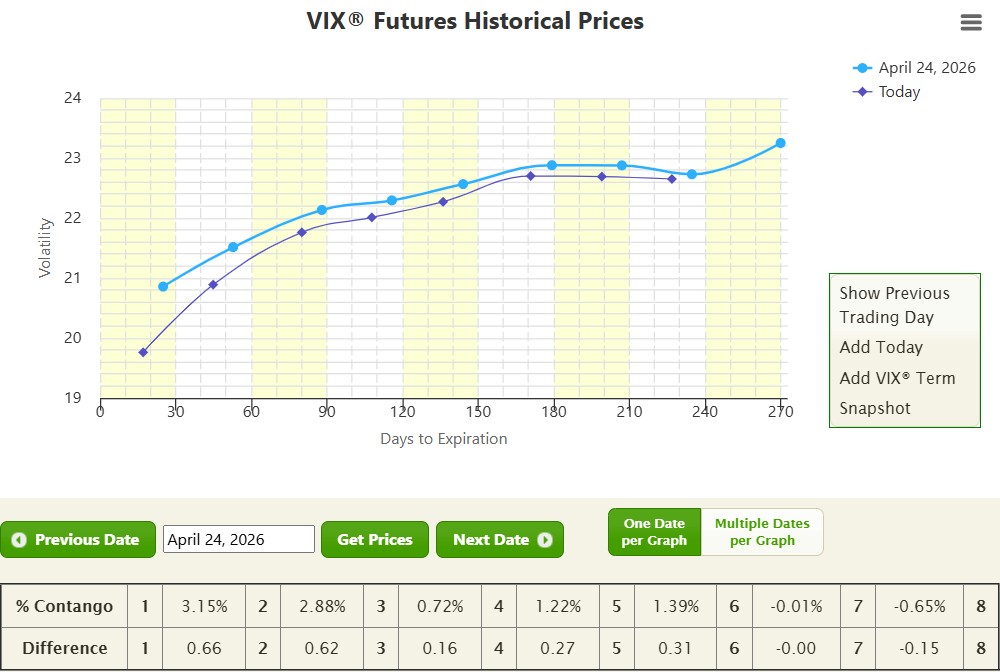
D. Market Summary — SPX technical analysis with key support and resistance levels, VIX futures structure (contango/backwardation readings across 8 expirations), and the full CBOE VIX futures curve chart updated to Friday's close.
This is not a newsletter written to fill a content calendar. It is the exact analysis I use to decide which trades to open, how to size them, and which adjustments to make, shared publicly every Sunday.
Full editions are available to registered subscribers only. Register below for free — then scroll down to see recent examples.
Join traders who receive Pedro's weekly SPX market thesis, VIX analysis, and live fund update every Friday. No charge. No spam. Unsubscribe with one click.
Implied Volatility Weekly
A. Market Outlook
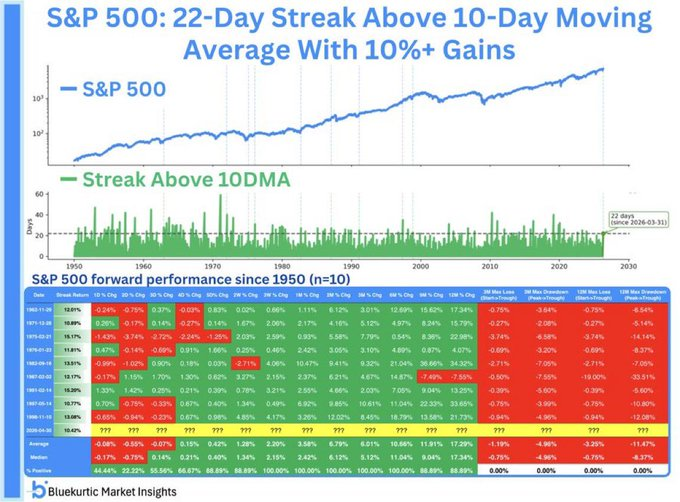
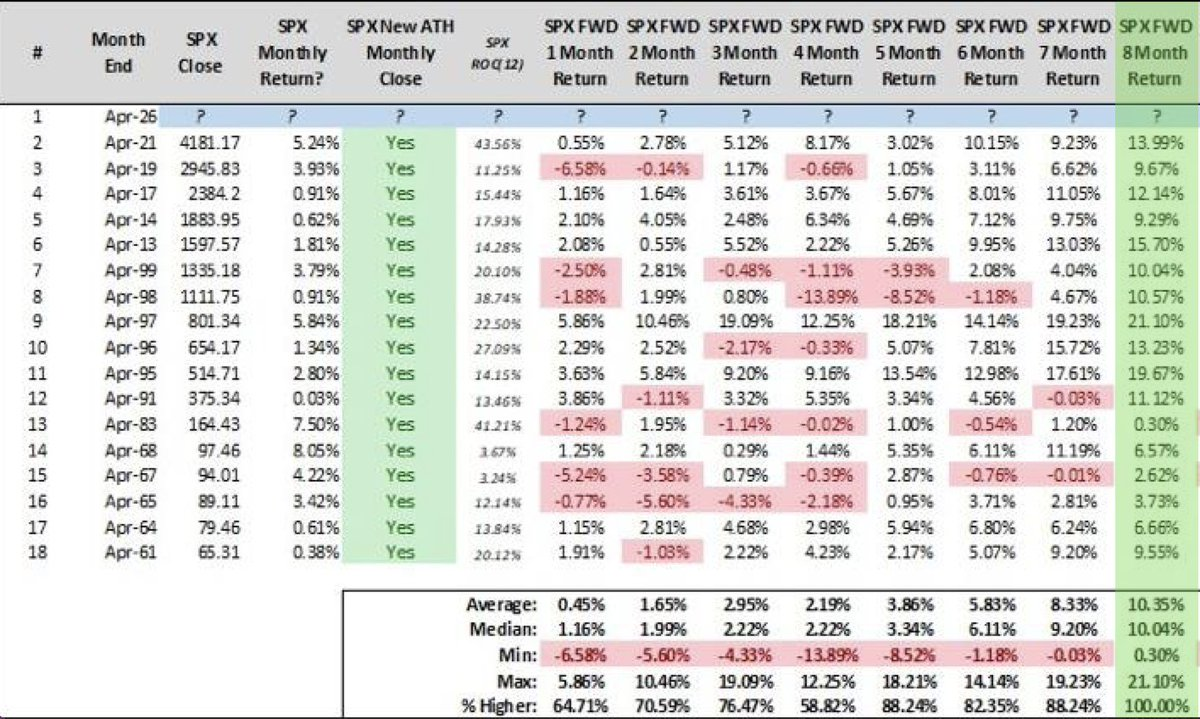
The constructive framework built over the past several weeks continues to strengthen, and the quant signals entering May are some of the most compelling of the entire year. The most remarkable new data point is a momentum thrust with almost no historical precedent. For the first time in 28 years (only the 10th occurrence ever), the SPX stayed above its 10-day moving average for 22 straight days while gaining 10%+. Forward returns following this setup have been positive every single time over the next one to six months. This is a perfect record!
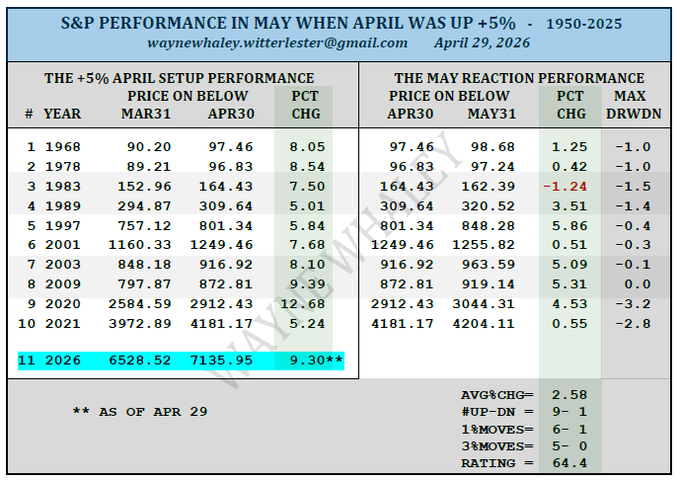
May itself is set up unusually well. Since 1950, May has been a pedestrian month for the S&P 500, averaging just +0.38%. But in the ten years since 1950, when April closed up at least 5% (April closed with +10%), May's track record improves dramatically to 9-1, with an average gain of 2.58%. The last seven occurrences post1985 were all positive. The "Sell in May" crowd faces a very unfriendly dataset this year...
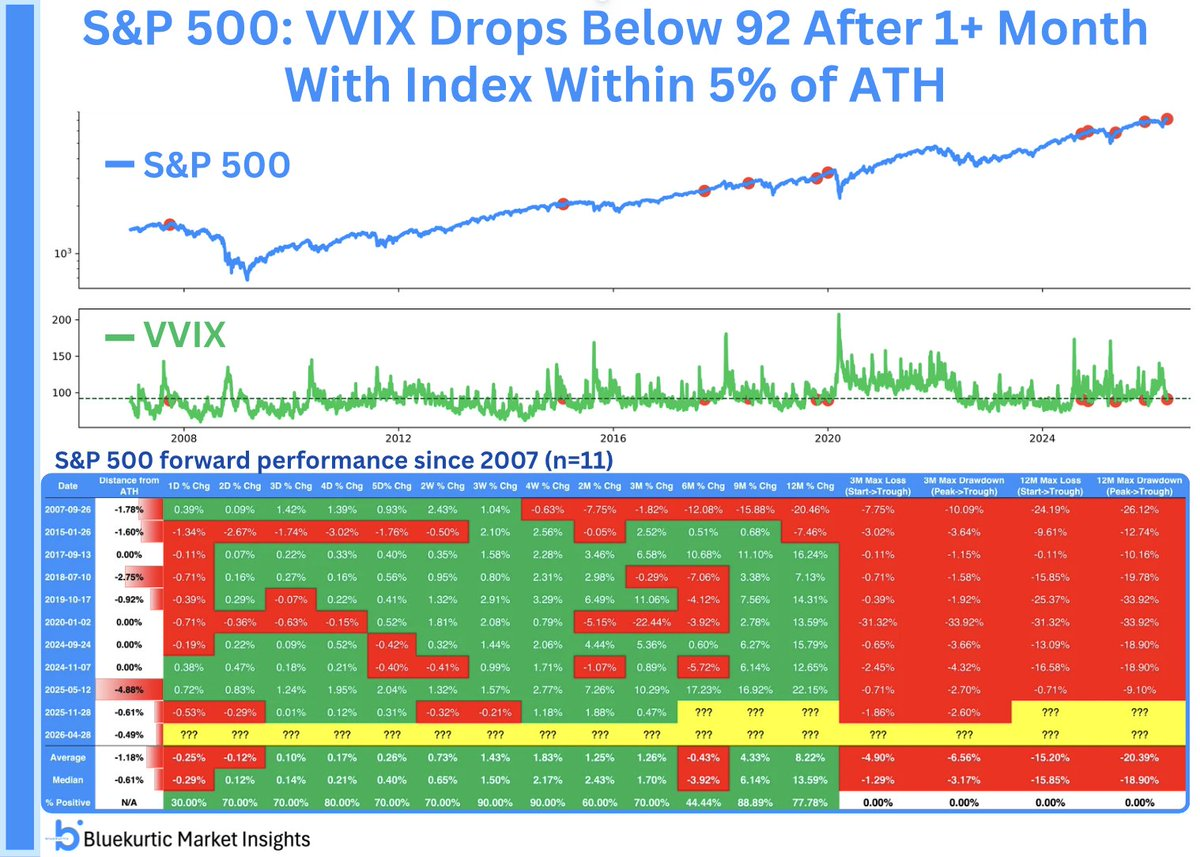
The VIX picture adds further confirmation. The VVIX has now fallen back below where it started 2026, meaning volatility-of-volatility has fully normalized. When volatility cools after an extended elevated phase with the SPX at ATHs, the S&P 500 has been higher four weeks later 9 out of 10 times, with a median gain of +2.2%.
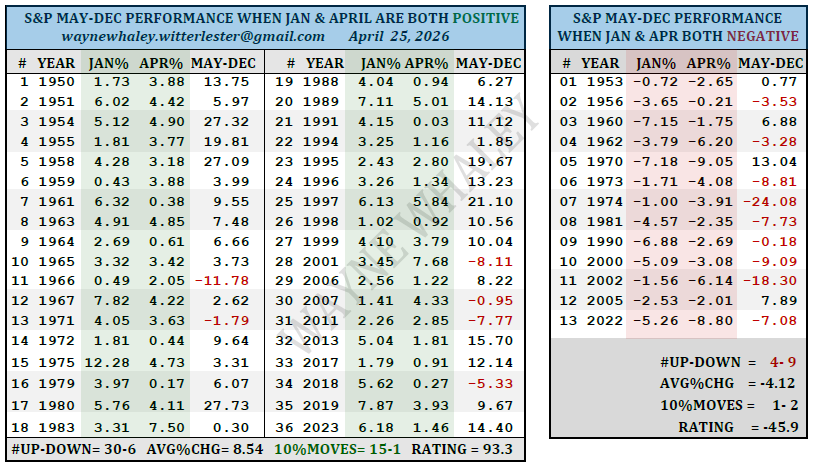
Looking further out, the year-end outlook becomes even more striking when you stack the signals together. When the SPX closes April at a new all-time high at close, the remainder of the calendar year has never been negative since 1950. A perfect 17 for 17, averaging +10.35% for the rest of the year. And with both January and April closing positive, the last eight months of the year (May–December) improve to 30-6, with an average gain of 8.54% and 10%+ moves running 15-1 to the upside.
This all fits squarely within the bigger picture thesis for 2026. The year's correction (a 9.6% peak-to-trough drawdown) appears to be behind us. The TOY and January Barometers confirm the bullishness for the end of the year. The working roadmap continues to call for a choppy but ultimately higher market, with the year's ATH likely forming in November or December. The quants are not just constructive; they are historically emphatic.
Actionable trade insights:
Directional trades, like the SPX Quants, can be considered at any technical correction. But the exogenous event (Iran War) and its news should continue to influence the market.
The preferred approach in the current environment is to prioritize income-oriented structures with controlled positive delta bias (SPX Best, SPY Ride), allowing continued time premium capture while leaving sufficient room for technical pullbacks.
Delta-negative VXX structures (e.g., VXX Short Call Verticals) should be avoided.
***
TRADE PLAN: Open SPX BEST or SPY Ride Trades in IV PEAKS. Use positive bias at opening.
The Bigger Picture for 2026: Choppy Market until November, with expected correction >10% from ATH!
• Bullish TOY Barometer: average 12-month return of +16%
• January Barometer: average annual return of +17%
• In years when January delivers a positive $SPX return, 87% of those years finish positive, with an average Rest of Year (ROY) return of +12%
• BUT: The SPX still has to deliver a >10% correction (average -14%) - Correction done with 9.6% (from peak to low)
Conclusion: We should observe a technical correction in the coming weeks. But it should print an ATH in May. For the EoY, SPX should print the year's ATH in November/December.
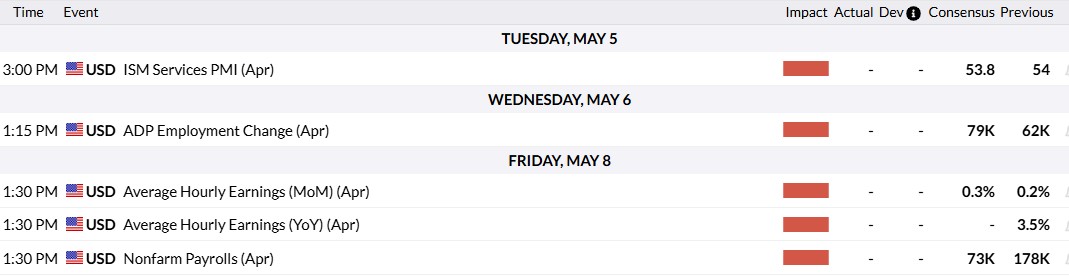
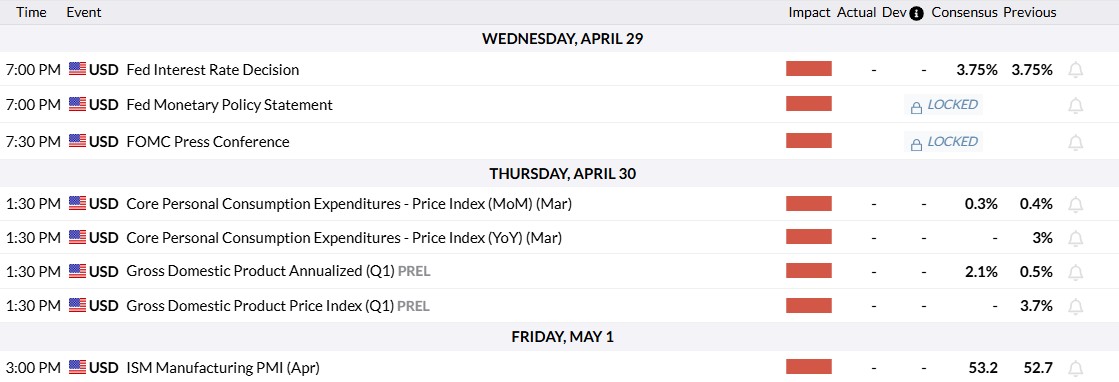
Next Week's key events:
B. Hedge Fund Performance
NetLiq: $73844 (YTD 1.3%) ......................... ( +268% since Jan 22)
SPX: 7230 (YTD 5.6%) .................................. (+51% since Jan 22)
..
Weekly Highlights & Short-Term Considerations:
✅ The Fund increased its value during the past week. The increase was mainly due to the decrease in IV and some gain from overall positive Delta from trades.
✅ The SPX Best Trades continued to recover and only the 18JUN is showing a small drawdown. The 30JUN trade is showing a nice unrealized profit. The 15MAY was closed at a small loss. It was a decision to exit the trade and open the 17JUL to reduce overall portfolio risk.
✅ The SPY Ride Trade is now under unrealized profit. During the week, we rolled the front month to the next monthlies (18JUN) expiration and due to the SPY price increase, we had to reduce its negative Delta by performing a "Calendar Swap". After this adjustment, the trade shows a positive Delta, which is aligned with our market expectations for May.
.
🎯SPX Key level to watch to consider taking adjustments: 7000
📊Portfolio Greeks: SPX: Delta: -5.1 / Theta: +60 / Vega: -531......................... SPY: Delta: +46 / Theta: +47 / Vega: +672
C. S&P Quants Research
For the first time in 28 years, and 10th occurrence ever, the SPX stayed above 10-DMA for 22 straight days while gaining 10%+ Momentum THRUSTS like this are not just rare, but VERY bullish. Forward returns positive EVERY. SINGLE. TIME. over the next 1 - 6 months.
A 9-1 SETUP FOR MAY - COMPLIMENTS OF A +5% APRIL Since 1950, the month of May is 47-29 for a very pedestrian, avg monthly gain of 0.38%. As of April 29, with one trading day remaining in the month, the S&P is up 9.30% for April. In those ten years since 1950 in which April was up at least 5%, the performance for May improves to 9-1 for an avg monthly gain of 2.58% with the last seven, post 1985, cases all positive.
Again, bad news for sell in May crowd. The VIX volatility index, VVIX is now below where it started 2026. Volatility cooling after an extended elevated phase, especially with SPX at ATHs, has been bullish. 4 weeks later, S&P 500 was higher 9/10 times with a median gain of +2.2%.
Since 1950, when SPX closes the month of April at a new all-time high monthly close, the remainder of the calendar year's performance has NEVER been negative. A perfect 17 for 17, for an average return of +10.35%.
When January and April are both positive, it delivers good news for the year. Since 1950, the S&P is 54-22 in the last 8 months of the Year (May-December) for an average, 8 month, gain of 5.58% with 10% moves 25-7 to the positive. The month of January was up 1.37% and as of April 25, April is up 9.75% with four trading days in the month remaining. If January & April are both positive, the last eight months of the year improve to 30-6 for an avg gain of 8.54% with THE 10% MOVES 15-1 to the positive. This contrast dramatically to those 13 years in which both months were negative, which led to a 4-9 last eight months of the year for an avg loss of 4.12%.
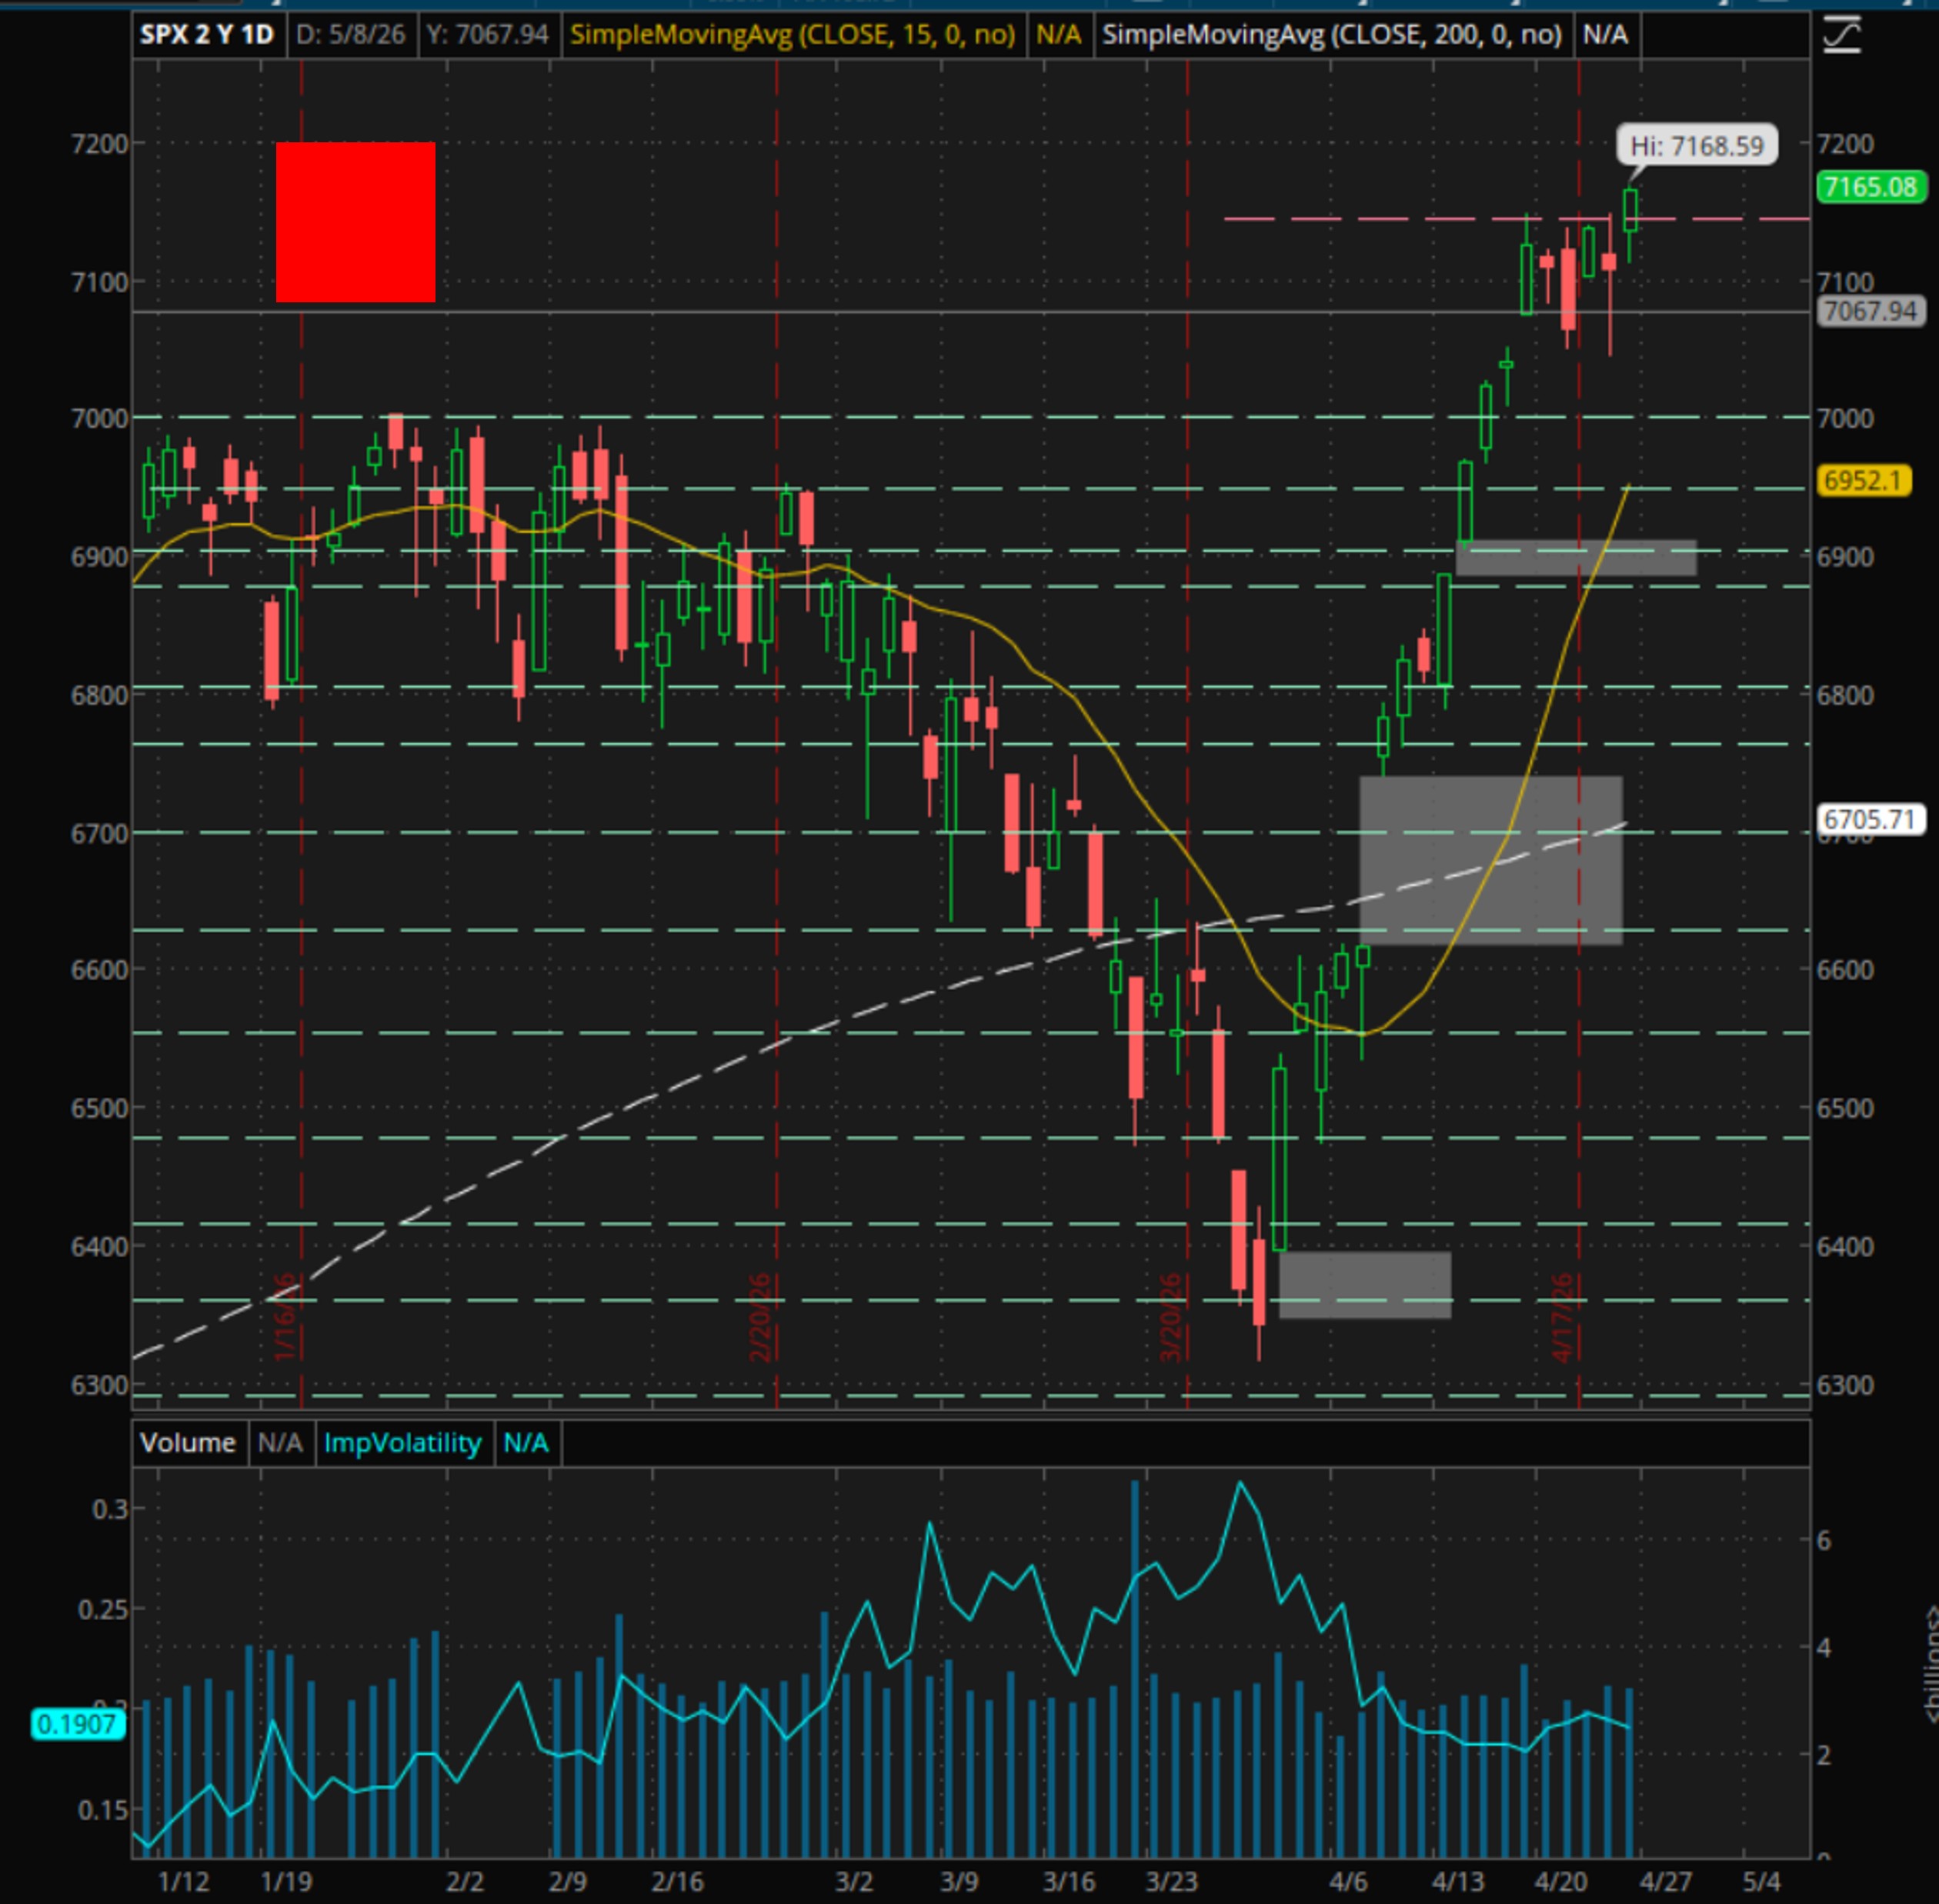
D. Market Summary
Note: The color Square below checks the market conditions to open the 15 SPY Put Spread: GREEN means conditions to open trades are met; RED means conditions are NOT met!
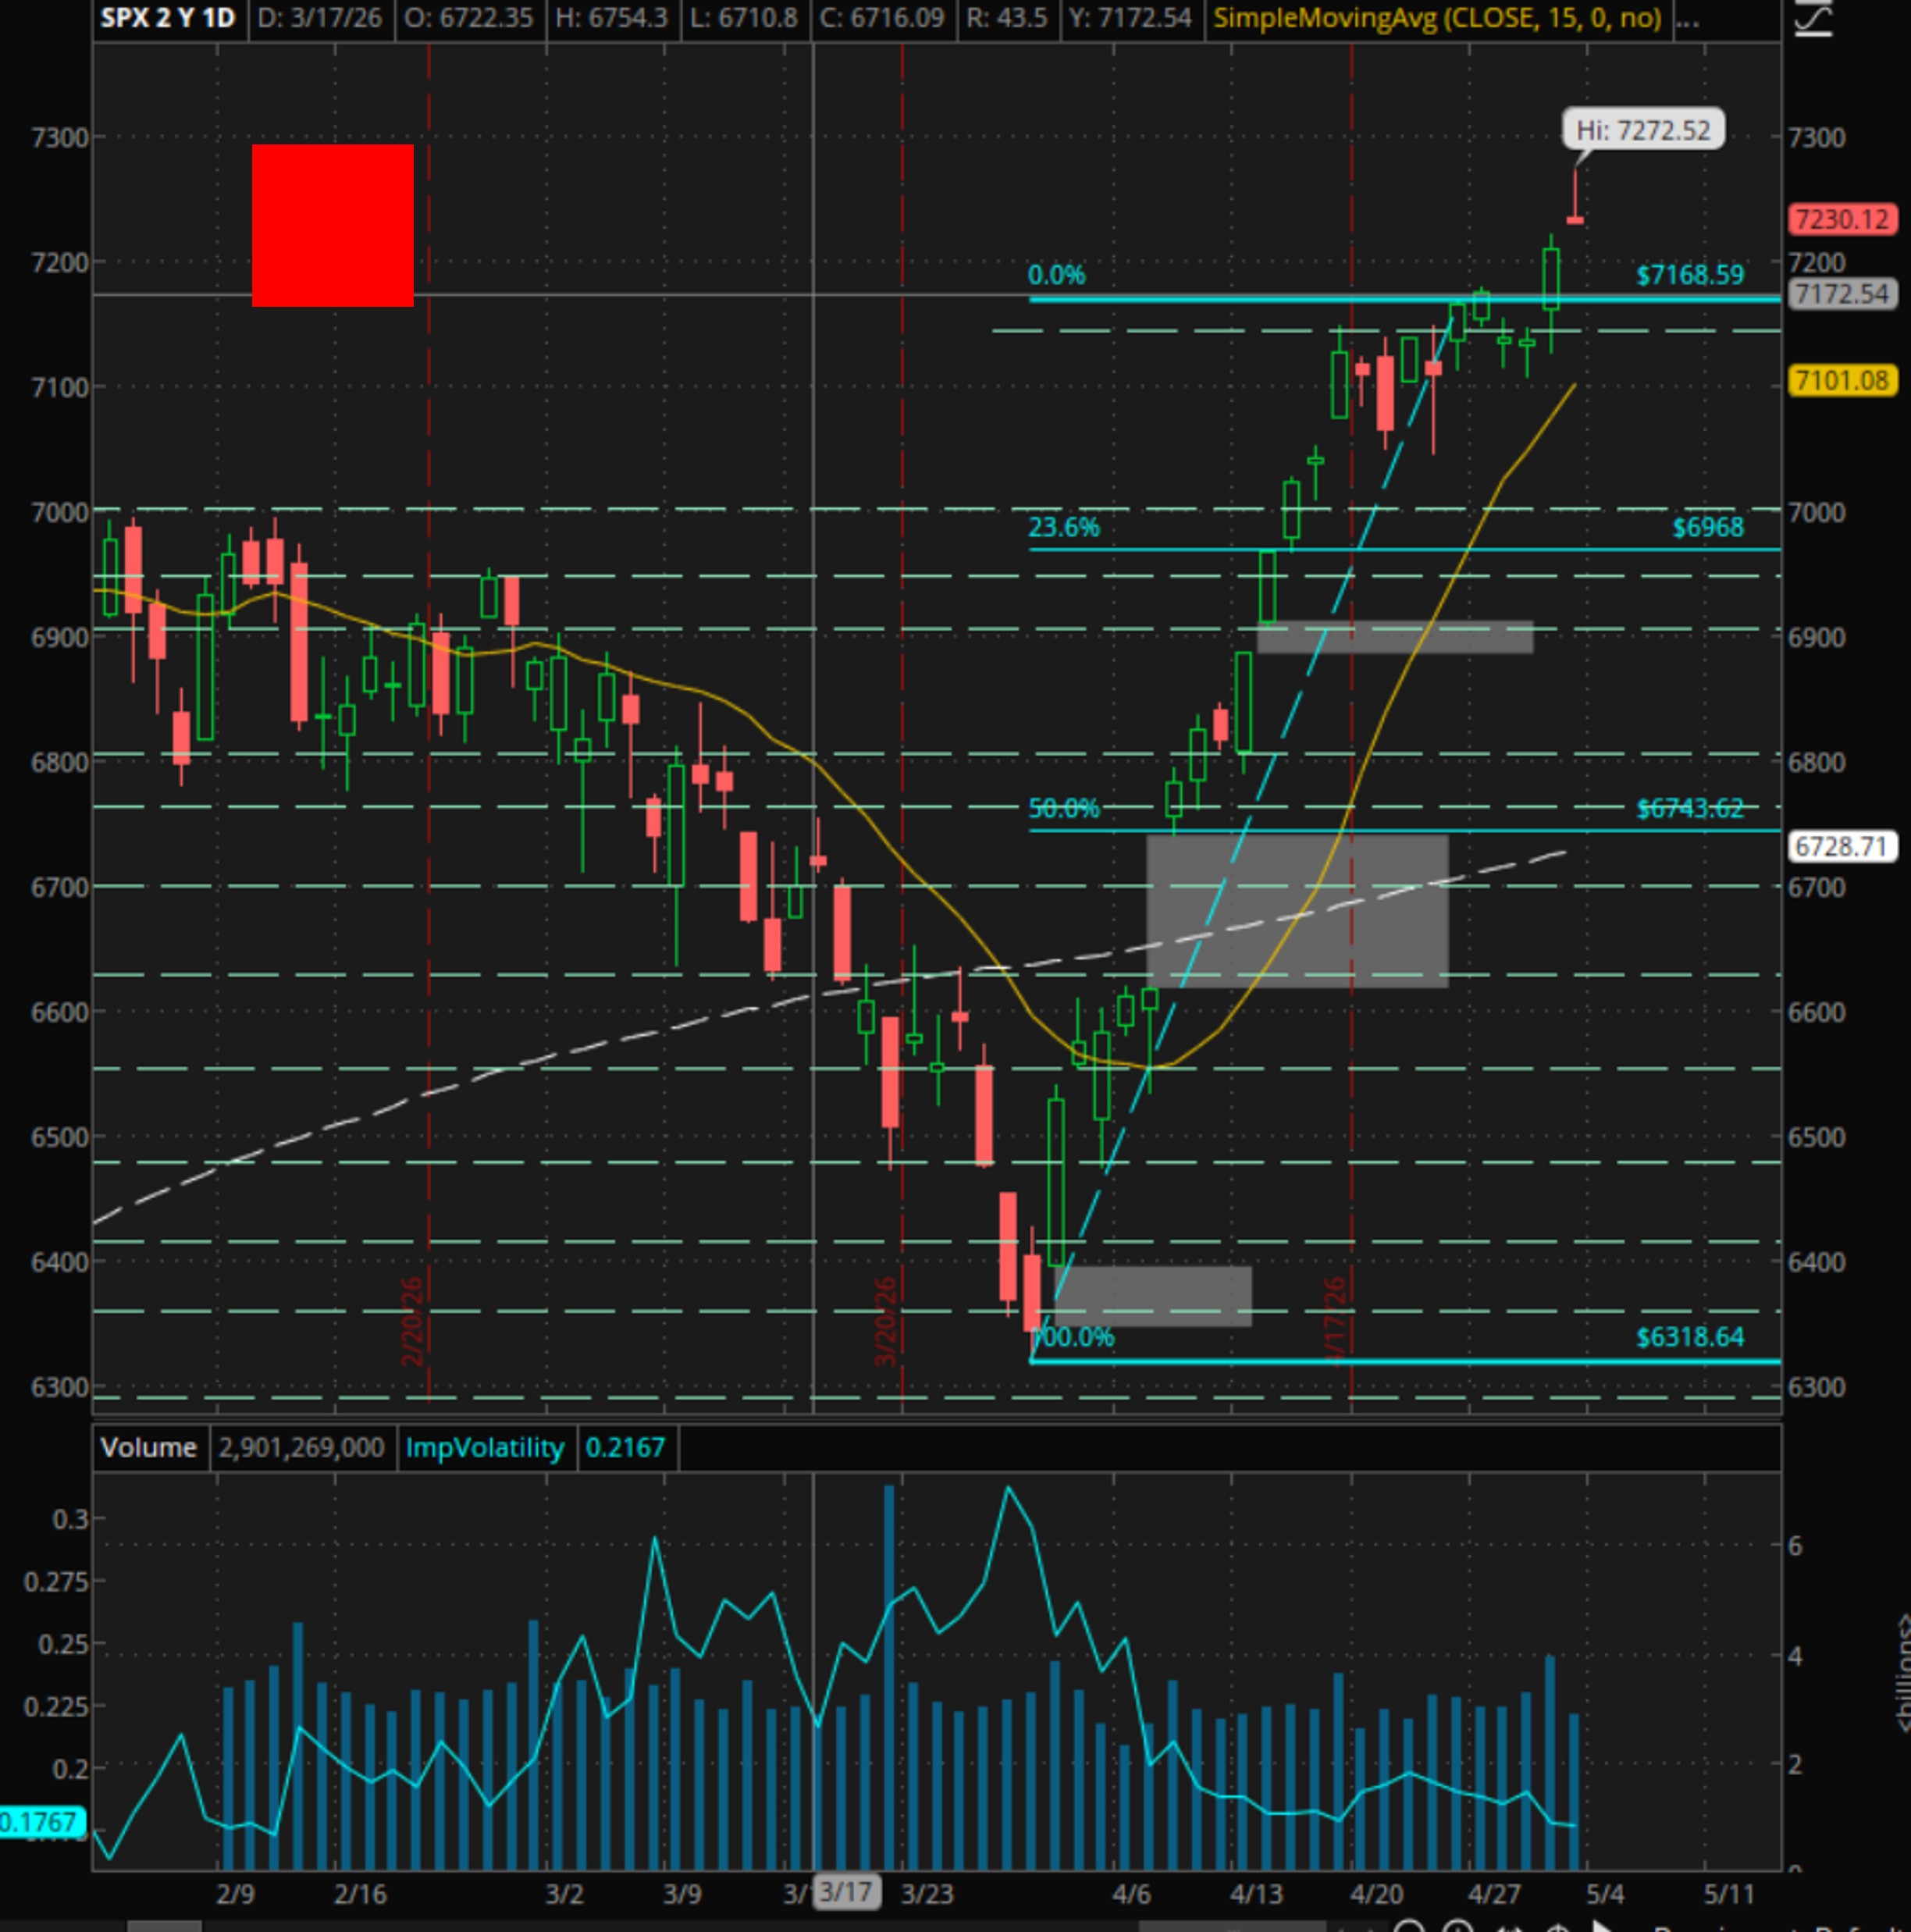
SPX Technical Analysis:
1. Key zones near the SPX price:
Resistance at 7270 (ATH)
Support at the 7140
2. SPX is under positive bias
VIX futures structure analysis:
The Volatility decreased a bit during the past week. The futures curve continues under a "normal" shape, with Contango between all expirations. The 2-front months are now in Contango at a low level (3.1%). A good environment for VXX negative Delta strategies.
VIX closed the week below at 17.03 - still a high reading considering the big move up by SPX: market participants continue to hedge against bad news that may arise from Iran/USA negotiations.
Implied Volatility Weekly
A. Market Outlook
Last week's outlook proved well-calibrated. The S&P 500 continued its historic run, with the index closing at fresh all-time highs and the broader tape remaining remarkably resilient despite the April 21 ceasefire deadline passing without a formal peace agreement. The market's ability to hold gains in the face of unresolved geopolitical risk is itself a signal worth noting.
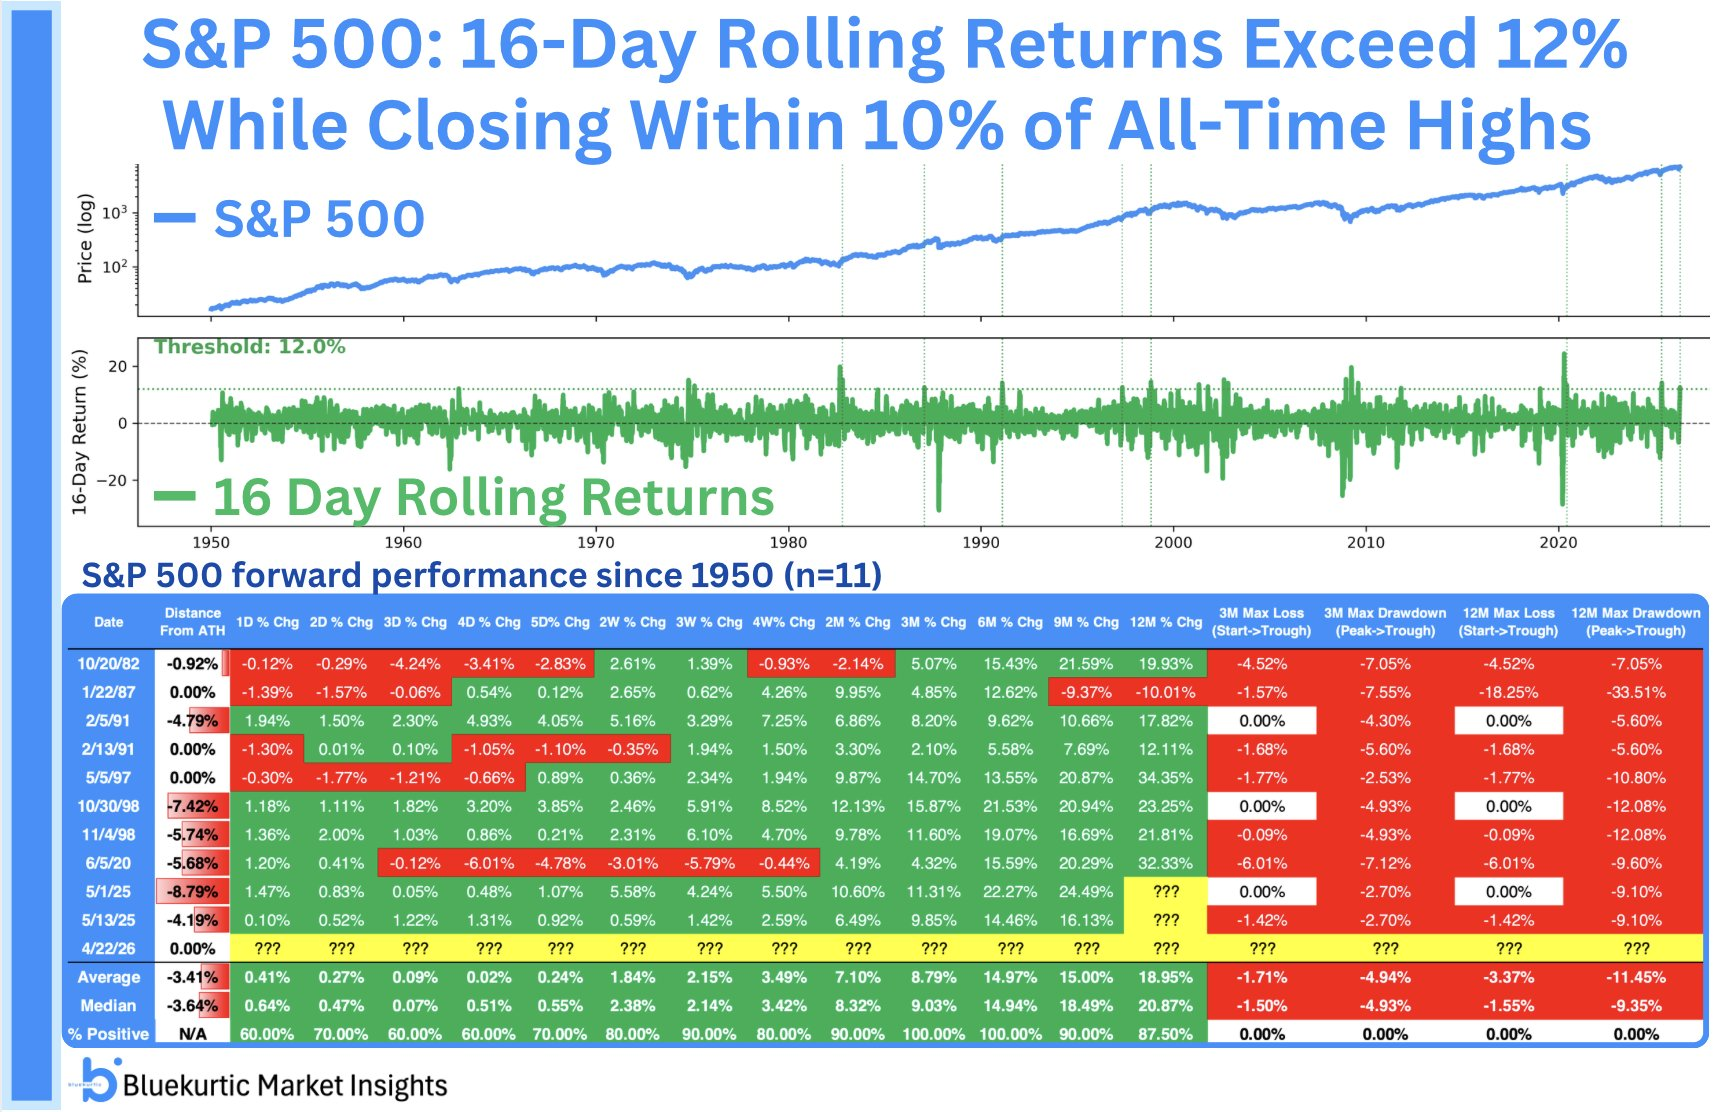
The quant backdrop this week is among the most constructive of the year. The SPX has now risen for four straight weeks with a 12%+ gain. Only the 11th time since 1950 and the first since 2011. Six months later, the index was higher 9 out of 10 times, averaging +9.5%. Complementing that, the SPX gained 12%+ in just 16 days while closing within 10% of ATHs: a setup seen only 11 times since 1950, with the index higher 100% of the time three months later, at a median gain of 9%.
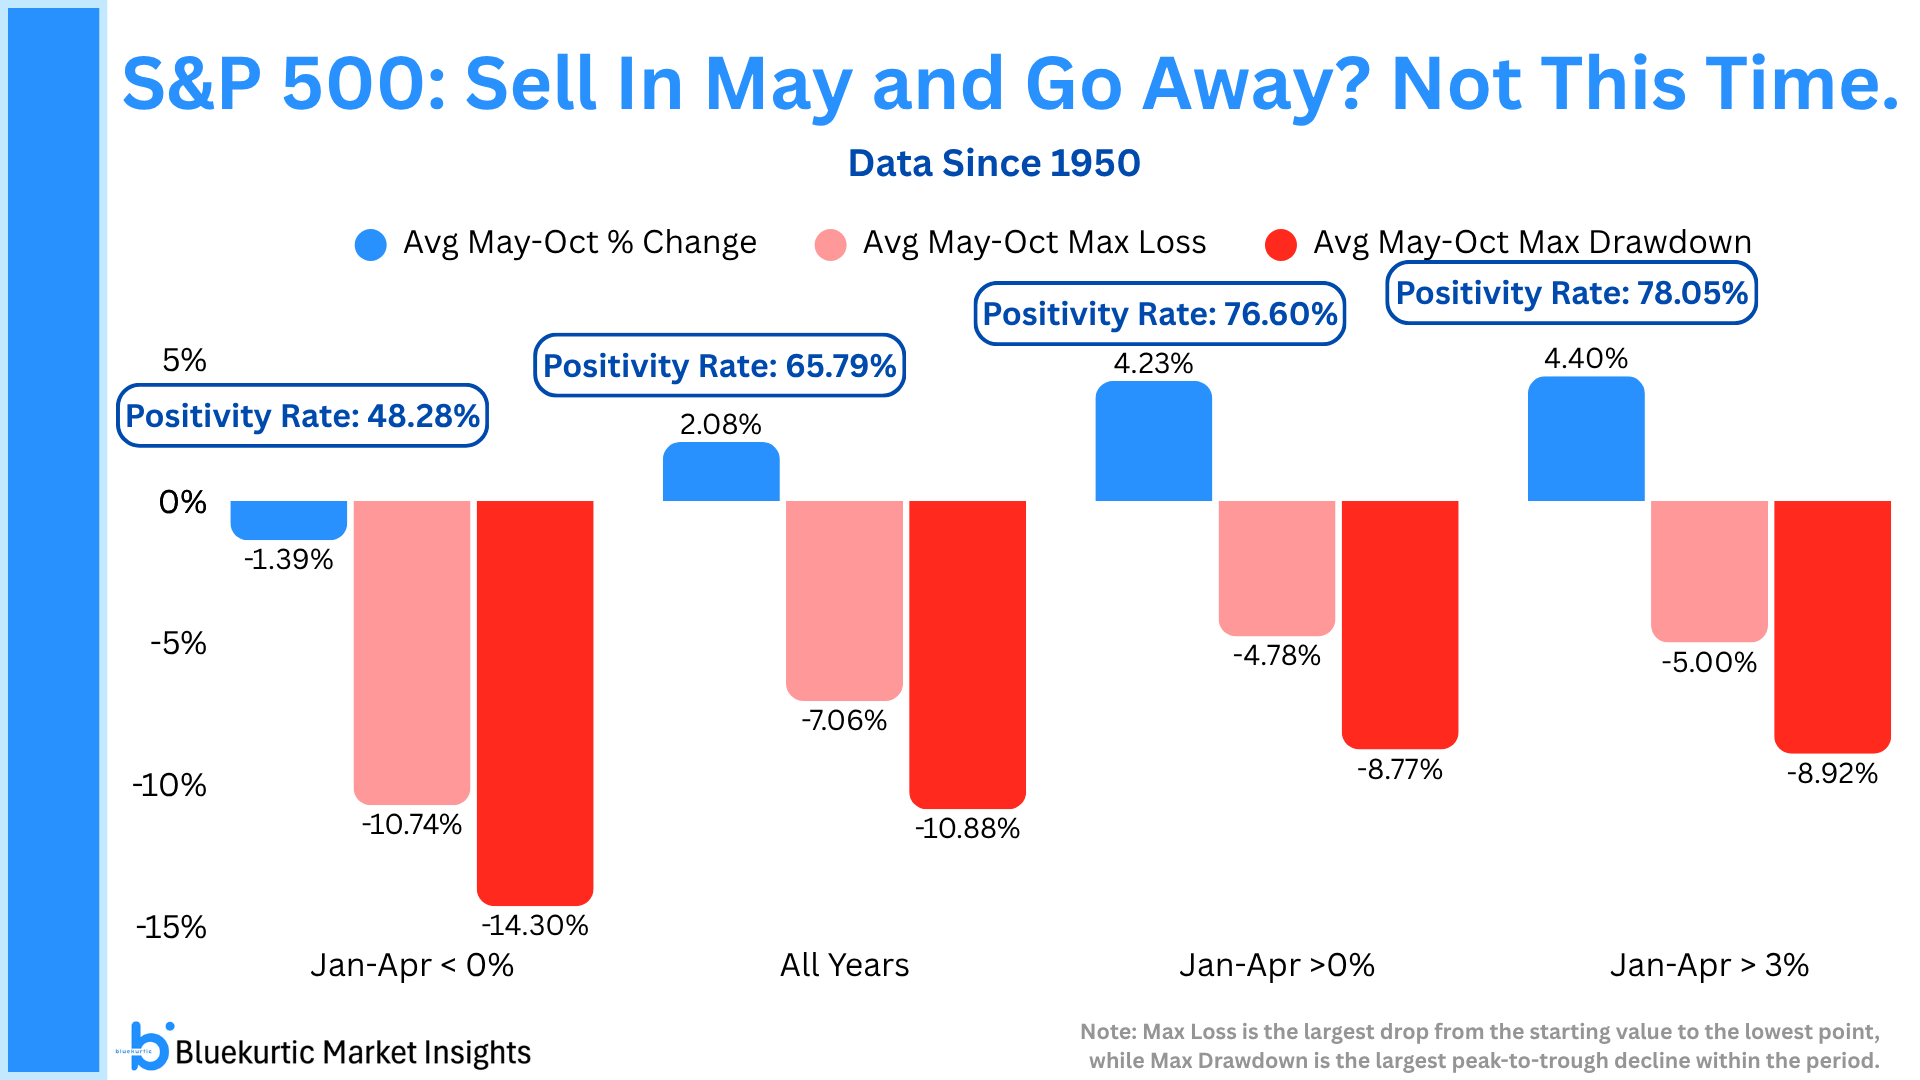
For those tempted by seasonal caution, the "Sell in May" instinct finds little support in the numbers this year. With the S&P 500 already up over 4% year-to-date heading into May, history shows the May–October period has delivered both stronger returns and meaningfully lower drawdowns versus years where the index entered May in weaker shape. And with new all-time highs printed in April, the seasonal pattern adds further confidence: the S&P 500 has topped for the year in April only once since 1980. New ATHs in April have historically portended higher highs in the months ahead.
This aligns with the bigger picture framework for 2026. The Bullish TOY and January Barometers point to average annual returns of +16% and +17%, respectively, and in years when January delivers a positive SPX return, 87% finish positive with an average Rest of Year return of +12%. The year's correction, a 9.6% peak-to-trough drawdown, now appears to be behind us, consistent with the expectation that SPX lows form in the first half. The working thesis remains: choppy but ultimately higher, with the year's ATH likely printing in November or December.
The risk to monitor is that the market has moved far and fast. Geopolitical uncertainty has not been fully resolved, and with hedge funds sitting on massive short positions at record highs, volatility can re-emerge quickly on any diplomatic setback or earnings disappointment. A technical consolidation before the next leg higher would not be surprising. And within the bigger picture, it would be healthy. The trend is up, the quants are supportive, and the structure of 2026 continues to develop largely as anticipated.
Actionable trade insights:
Avoid directional trades, like the SPX Quants. An exogenous event (Iran War) and its news continue to influence the market.The markets are reacting to news.
The preferred approach in the current high IV environment is to prioritize income-oriented structures with controlled positive delta bias (SPX Best, SPY Ride), allowing continued time premium capture while leaving sufficient room for rotational pullbacks.
Delta-negative VXX structures (e.g., VXX Short Call Verticals) should also be avoided.
***
TRADE PLAN: Open SPX BEST or SPY Ride Trades in IV PEAKS. Use positive bias at opening.
The Bigger Picture for 2026: Choppy Market until November, with expected correction >10% from ATH!
• Bullish TOY Barometer: average 12-month return of +16%
• January Barometer: average annual return of +17%
• In years when January delivers a positive $SPX return, 87% of those years finish positive, with an average Rest of Year (ROY) return of +12%
• BUT: The SPX still has to deliver a >10% correction (average -14%) - Correction done with 9.6% (from peak to low)
The SPX has traded below the December low during March. This is a Red Alert!
Conclusion: We should continue to observe a choppy market; SPX should print the year's ATH in November/December. We may experience a technical correction soon, before the SPX resumes its upward trend.
Next Week's key events:
B. Hedge Fund Performance
NetLiq: $71555 (YTD -1.9%) ......................... ( +256% since Jan 22)
SPX: 7165 (YTD 4.7%) .................................. (+49% since Jan 22)
..
Weekly Highlights & Short-Term Considerations:
✅ The Fund increased its value during the past week. Despite the small variation of IV, the small positive Delta of our trades and high Theta from the SPY Ride and SPX Best 15MAY were the key responsibles from the account appreciation. The SPX moved up a bit along the week and is topping the "soft hedges" of the SPX Best Trades.
✅ The SPX Best Trades continued to recover from drawdowns. The 15MAY trade is now showing an above-average negative Delta and should be adjusted on Monday to become neutral/positive. The 18JUN is well positioned and practically showing Delta neutrality as the 30JUN which is already showing an attractive unrealized profit.
✅ The SPY Ride Trade is recovering well and is almost at break-even. At close, it is showing a negative Delta, although there is still room for the upside until the SPY price reaches the upper Calendar strike. The Delta/Theta ratio is safe ~0.30. We should roll the front-month options to the following monthlies to continue in trade and capture additional premium.
..
🎯SPX Key level to watch to consider taking adjustments: 6700
📊Portfolio Greeks: SPX: Delta: -1.8 / Theta: +84 / Vega: -366......................... SPY: Delta: -50 / Theta: +205 / Vega: +1462
C. S&P Quantum Research
The S&P 500 has had its strongest weekly gains in 15 years. SPX has risen for 4 straight weeks with a 12%+ gain, for the first time since 2011 and only the 11th time since 1950. Six months later, the index was higher 9 of 10 times, averaging +9.5%.

When S&P 500 is up over 3% YTD by May, the May–October period has delivered stronger returns compared to other years. Not only are returns higher, but SPX drawdowns during this period have also been much lower.
S&P 500 momentum at new highs is a bullish signal for the market. SPX gained 12%+ in 16 days while closing within 10% of ATHs only 11 times since 1950. 3 months later, index was higher 100% of the time, with a median gain of 9%.
The S&P 500 has only topped for the year in the month of April once since 1980. If a new all-time high in April occurs (as it has), it likely portends higher-highs in the months ahead.
D. Market Summary
Note: The color Square below checks the market conditions to open the 15 SPY Put Spread: GREEN means conditions to open trades are met; RED means conditions are NOT met!
SPX Technical Analysis:
1. Key zones near the SPX price:
Resistance at 7150
Support at the 7000
2. SPX continues under negative bias
VIX futures structure analysis:
The Volatility increased a bit during the past week. The futures curve continues under a "normal" shape, with Contango between all expirations. The 2-front months are now in Contango at a low level (3.1%). A good environment for VXX negative Delta strategies.
VIX closed the week below at 18.7 - a high reading considering the big move up by SPX. Market participants continue to hedge against bad news that may arise from Iran/USA negotiations.