The SPX Best Strategy is my flagship income strategy, traded in my own account for more than 250 documented trades.
Inside MyOptionsEdge, you won't simply learn the rules of the strategy. You'll watch it applied in live market conditions, understand every adjustment, and see the complete decision-making process from entry to exit.
This isn't just a strategy course. It's a framework for becoming a more confident SPX options trader.
📊 83% win rate · 💰 Avg $1,090 profit per trade · 📈 ~15% monthly return · 🔄 3 open positions simultaneously
Verified monthly on the Trading Account page →
The SPX Best isn't a strategy you learn in a weekend. It's a discretionary approach — which means the entry logic, strike selection, and adjustment decisions require market judgment that develops over time from watching real trades happen in real conditions."
"That's why the course lives inside the Trading Community. Members don't just study the framework — they follow every live trade I place using this strategy, with the full rationale posted in real time. That combination of structured education and live trade observation is what actually builds competence. Reading alone doesn't.
The SPX Best uses a broken wing butterfly (BWB) structure on SPX put options. It is a non-directional, income-generating strategy that profits from two sources:
Theta decay — the position generates positive theta from day one. Time passing works in your favor.
IV contraction — the position is Vega negative. When implied volatility decreases after a spike, the position benefits.
The structure targets a wide price range where SPX can move — up, down, or sideways — while still delivering a profit. This is what "non-directional" means in practice: not that the market must stay flat, but that the position is built to profit across a broad range of market outcomes.
What makes it different from a standard butterfly:
A broken wing butterfly is asymmetric — the wings are not equal width. This creates a position with a credit at entry (you receive premium) and defined risk on one side only. The skewed structure allows for more aggressive theta collection while keeping the risk profile manageable and adjustable.
Minimum account size: $4,000 suggested. Typical capital allocated per position: ~$7,000.
Time commitment: 15–30 minutes per day to monitor. Adjustments average less than once per week outside of the final 30 DTE period.
--------------------------------------------------------------------------------------------------
-> Strategy performance (through March 26):
A 4-year, trade-by-trade analysis of the SPX broken-wing butterfly + vertical strategy, covering 58 closed trades from June 2022 to March 2026. The strategy posted an 89.7% win rate and a ~5.0x profit factor, generating roughly $34,500 in net P&L. Its few losses were concentrated in a single volatility event (the April 2025 tariff-driven selloff), exposing the strategy's main weakness: fast, news-driven directional moves. The data shows quick recovery after drawdowns, with full losses recouped within two trade cycles. Full trade-by-trade breakdown, methodology, and FAQ inside.
Check also this CASE STUDY of a past real SPX Best trade.
------------------------------------------------------------------------------------------------
The SPX Best is the primary driver of my fund's overall performance. The full monthly fund record — going back to January 2022 — is publicly available on the Trading Account page. Every trade, every month.
→ View the complete performance record
Strategy Course — the complete framework: how the BWB structure is constructed, how strikes are selected, what the adjustment rules are, and when and how to exit.
Risk profile walkthroughs — how to read the payoff diagram in thinkorswim, what the Greeks look like at entry and how they evolve through the trade, what delta targets to maintain.
Live trade access (Trading Community) — every SPX Best position I open is posted in the Discord trading room in real time: the strikes selected, the entry rationale, the payoff diagram, and the brokerage screenshot. You see exactly what I trade and why, the moment I trade it.
Trade posts with full adjustment history — after every adjustment and at close, a full trade post is published to the Community Center showing the cumulative P&L, each fill, and the reasoning behind every decision.
I am actively trading this strategy, which is delivering exceptional results. You will gain access to all my trades in the Trading Community, which also includes access to a live trading room (Discord Channel) where you can interact with me. The trades are announced there when I enter them into the trading platform.
This options management style can be implemented with a minimum suggested account value of USD4000.
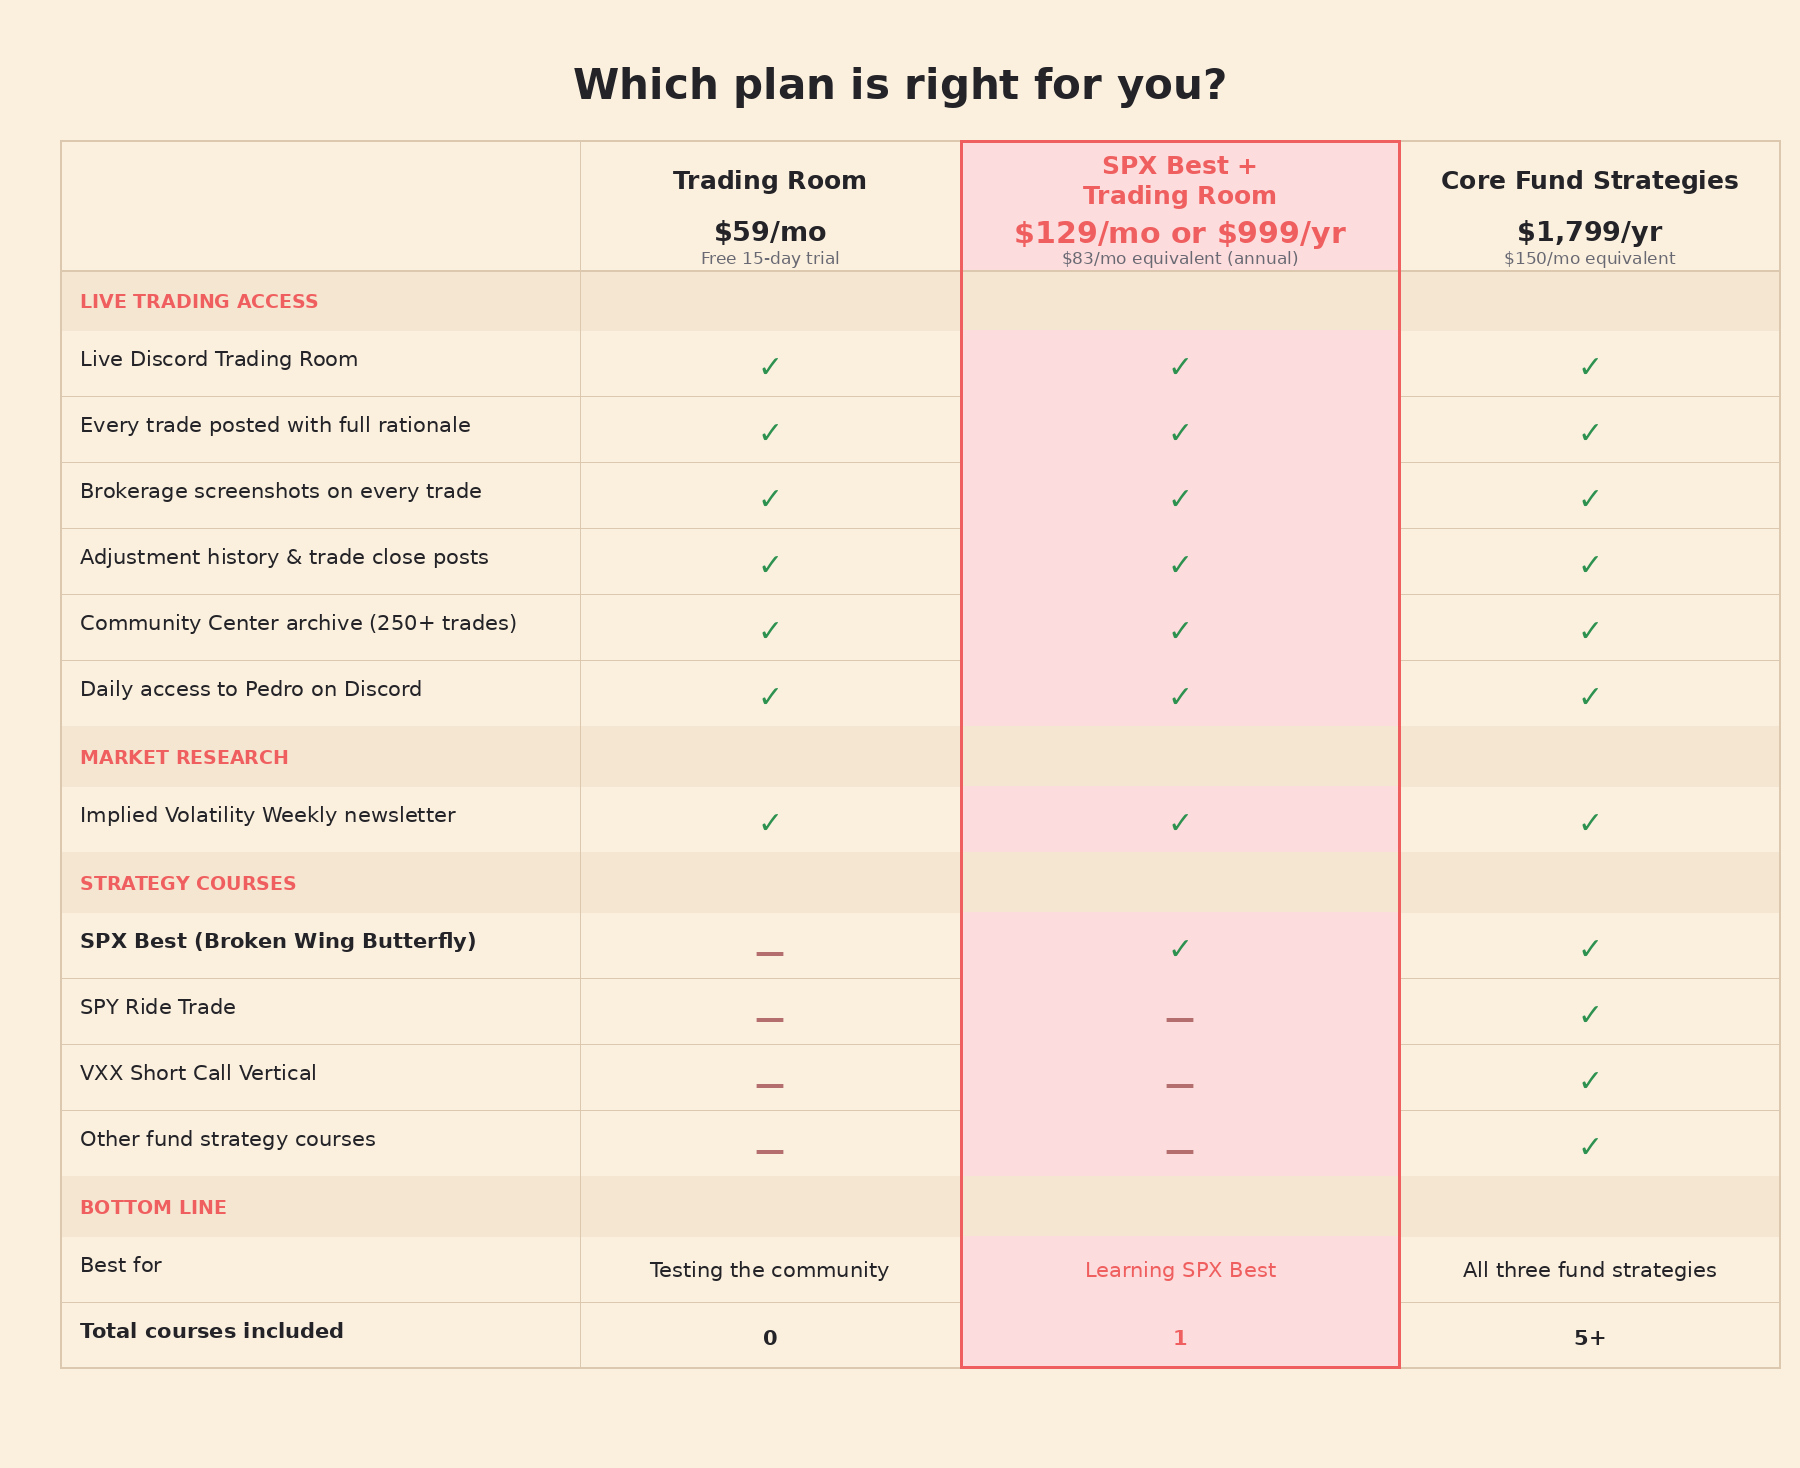
👉 New to MyOptionsEdge? Start with the $59/mo Trading Room plan — 15-day free trial, see every live trade I post, decide from there.
👉 Want to learn SPX Best properly? This plan: $129/mo for flexibility, or $999/yr to save $549.
👉 Want everything? Full Access includes all 13 strategy courses for $700 more.
In November 2025 I opened an SPX Best position on 26 November, made one adjustment on 8 January 2026, and closed on 15 January 2026 with a $1,605 profit against a $1,500 target — in 50 days.
Every fill, every rationale, and every screenshot from that trade is documented in the case study post: → Read the full SPX Best trade case study
This is what members see for every trade — not in a case study written after the fact, but in real time as the trade is happening.
In Chapter 4 we saw what the trade looks like at the moment of entry. Now we want to see how it EVOLVES as days pass and the market does (or doesn't) move. Understanding the natural trajectory of the trade — without any adjustments — is the key to knowing when an adjustment is needed and when it isn't.
Before we move into trade management and adjustments, let me share the most important things I've learned from trading this strategy live, over many cycles.
This is the most important chapter of the course. Opening the trade is easy. MANAGING it well — making the right adjustment at the right time — is where the strategy's true edge lives.
Quick-reference appendix on the four Greeks that drive every options trade. Useful for refreshing your fundamentals or onboarding less-experienced members.
You’ve got questions. I’ve got answers.
I am trading my own Account, where I am using this strategy. Everyone who wants to access my trades can enroll in the trading community, where I am disclosing all account trades in real-time through a Discord channel. But myoptionsedge is not a trade signal service: you are encouraged to learn and trade on your own after some time.

The $59/mo Trading Room plan gives you live access to every trade I post — but no structured course content. You see what I do, but not the underlying framework that explains why.
This plan adds the full SPX Best strategy course on top of Trading Room access. You can study the complete framework — strike selection, adjustment rules, soft hedge logic, the full Greeks playbook — then watch live trades that follow exactly that framework. It's the proper way to actually learn the strategy rather than just copy individual trades.
Best fit: if you want to understand WHY each trade is constructed and adjusted the way it is, not just follow signals.
Core Fund Strategies ($1,799/yr) includes THREE strategy courses: SPX Best, SPY Ride, and VXX Short Call Vertical — the three strategies I actively run in my fund.
This plan focuses ONLY on the SPX Best strategy. The trade-off is straightforward:
• If you ONLY want SPX Best: this plan at $999/yr saves you $549
• If you want all three fund strategies: Core Fund is the better deal — just $300 more for two additional complete courses.
Most members start here, then upgrade to Core Fund later once they're comfortable with SPX Best and want to add the other fund strategies to their rotation.
Yes, anytime. Your unused portion will be credited of your current subscription toward the Core Fund or Full Access upgrades. You won't pay twice for the time you've already covered.
Many members start with SPX Best, get comfortable with the strategy and the trading room rhythm, then upgrade to other Annual Membership after 3–4 months to add SPY Ride and VXX Short Call Vertical to their toolkit.
Yes.
Monthly: cancel any time before your next billing date. You keep access until the end of the current billing period, then auto-renewal stops. No questions, no friction.
Annual: paid upfront for 12 months. You can cancel auto-renewal at any time, but the current annual period isn't refundable (which is why annual carries a 26% discount vs. paying monthly).
Not on this plan. Both the monthly ($169/mo) and annual ($1,499/yr) plans bill immediately on signup.
The reason is straightforward: the SPX Best course is the core deliverable, and a free trial creates a path for trial-and-cancel that's unfair to paying members. If you want to experience the trading room before committing to the SPX Best course, the $59/mo Trading Room plan includes a 15-day free trial — that's the right entry point for "try before you buy." You'll see every live SPX Best trade I post during your trial, just without the course content.
If you decide the strategy is for you after the Trading Room trial, you can upgrade to this plan anytime and the unused portion of your trial month will be credited toward it.
Every SPX Best position I open goes into the Trading Room the moment I place it — with the full rationale, the strikes, the payoff diagram, and the brokerage screenshot. The next trade will be there. So will every adjustment. So will the close.
The best way to learn this strategy is to watch it happen in real market conditions, alongside the community, with every decision explained as it's made.
Past performance is not indicative of future results. Options trading involves significant risk and is not suitable for all investors. All performance data shown is from a real account and is publicly documented on the Trading Account page.