- Jun 20
SPX Broken-Wing Butterfly + Vertical: A 4-Year Performance Breakdown (2022–2026)
- Pedro Branco
- 0 comments
An original data analysis of 58 closed SPX options trades using a broken-wing butterfly core with tactical vertical overlays.
Key Takeaways
89.7% win rate across 58 closed trades from June 2022 to March 2026
Total net P&L of approximately $34,500 on a defined-risk options structure
Profit factor of ~5.0x; gross wins were five times larger than gross losses
The two largest losses (a combined -$6,910) both occurred during the April 2025 tariff-driven volatility spike
The strategy recovered fully within two trade cycles after its worst drawdown, posting +$2,570 and +$2,115 in the following two months
This is one of the core strategies we trade live, every cycle, inside our Community
What Is the SPX Best Strategy?
The strategy combines two SPX options structures, traded together on a recurring monthly (and sometimes weekly) cycle:
A broken-wing butterfly (BWB), typically built on SPX puts, with strikes asymmetrically spaced so the trade is opened for a net credit or near-zero debit. Because one wing is wider than the other, the structure carries directional skew rather than being purely delta-neutral.
A vertical spread, generally placed on the call side above the current price is used as a tactical hedge that gets rolled and adjusted throughout the trade's life as SPX moves.
The butterfly is the income engine (it profits from time decay and a market that stays within or drifts toward its body) and the vertical is the steering wheel: it's opened, closed, and re-struck repeatedly within a single expiration cycle to manage directional exposure as the underlying moves.
This is different from a standard iron condor or calendar spread strategy in one important way: the BWB's intentional skew means the position has an opinion about direction, and that opinion is actively managed rather than left static until expiration.
Performance Summary (June 2022 – March 2026)
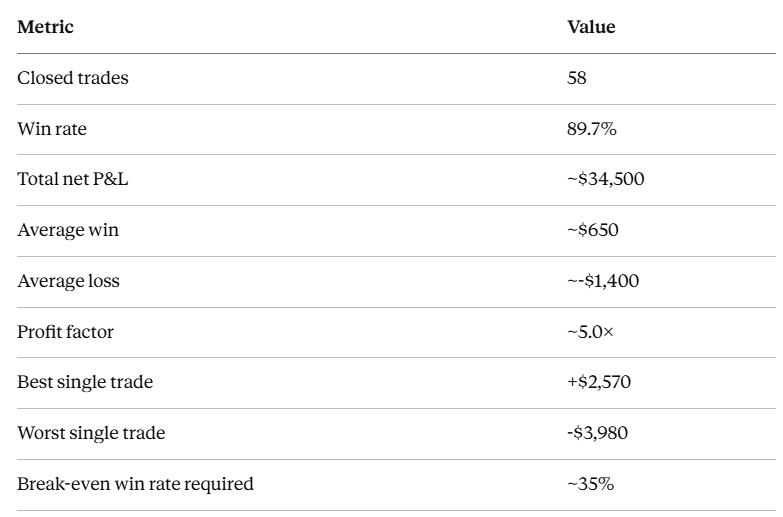
The strategy's actual win rate (89.7%) sits roughly 55 percentage points above the win rate required just to break even (~35%). That gap is the real measure of the strategy's edge — it's not that wins and losses are similar in size and the strategy wins more often than it loses; it's that the strategy wins far more often than the math requires, even though each individual loss is roughly twice the size of an average win.
Annual P&L Trend
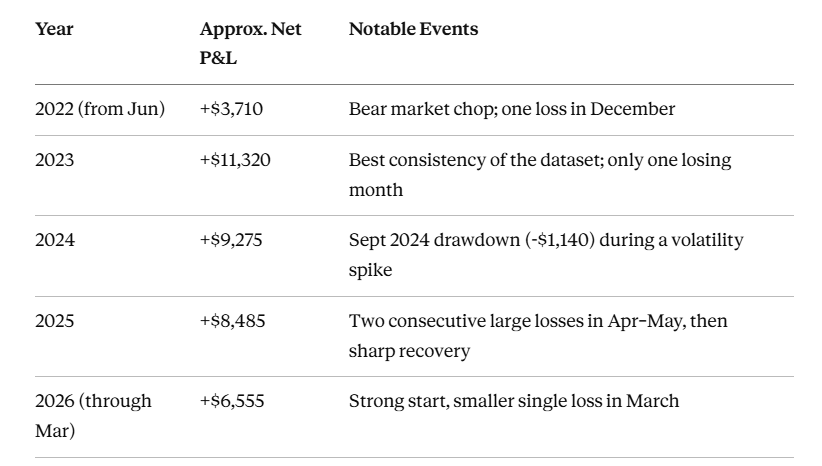
2023 stands out as the strategy's cleanest year — a trending, lower-volatility market environment is favorable for a butterfly structure that benefits from price staying within a defined range.
Where the Strategy Loses Money
Out of 58 trades, only 6 were losers. All six share a common trigger: a fast, large directional move in SPX that outran the rate at which the vertical hedge could be adjusted.
The two worst trades (April 2025 expiry (-$3,980) and May 2025 expiry (-$2,930) ) both trace back to the same market event: the early-April 2025 tariff announcement shock, which produced one of the sharpest multi-day SPX selloffs of the dataset's timeframe. The trade log shows repeated, increasingly large adjustments (rolling verticals down multiple times in a single week) as the strategy tried to keep pace with the decline. A pattern that's visible in the raw trade data as a cluster of same-day, same-week roll transactions not seen anywhere else in the four-year track record.
This is the vulnerability of this strategy: the strategy is built to profit from grinding, range-bound, small corrections or trending higher markets. And it is exposed during gap-driven, high-velocity selloffs, particularly ones triggered by macro/news shocks rather than technical drift. This effect can be minimized if the trades are closed before reaching 20-30 DTE.
How the Strategy Recovers
What the data shows clearly is the recovery pattern after a drawdown:
After the Sept 2024 loss (-$1,140), the very next trade returned +$1,880, followed by +$1,630
After the back-to-back April–May 2025 losses (-$3,980, -$2,930), the next two trades returned +$2,570 and +$2,115 — fully recovering the drawdown within two cycles
This is consistent with a strategy that re-enters a fresh, smaller position each cycle rather than averaging down on a losing trade. Because each butterfly/vertical combination is opened and closed independently, a bad month doesn't compound into a bad quarter. It's contained to that single expiration cycle by design.
The strategy shows the same underlying pattern common to high-win-rate, defined-risk options selling: small-medium, frequent wins funding occasional larger losses, with the loss-to-win ratio sitting close to 2:1 in both cases. The BWB strategy's higher win rate and profit factor come at the cost of a larger worst-case single-trade loss.
May 2026 brought another difficult stretch where the SPX moved up strongly. This months brought +$5400 profit. See the full breakdown of that month.
Curious how we manage the vertical hedge in real time, including during weeks like April 2025?
Frequently Asked Questions
What is a broken-wing butterfly in options trading?
A broken-wing butterfly (BWB) is a three-strike options spread (similar to a standard butterfly) but with unequal distance between the strikes. This asymmetry lets the trade be opened for a net credit, which removes the "max loss between the wings" risk a standard butterfly carries, at the cost of taking on directional risk if the underlying moves sharply toward the wider wing.
Why combine a broken-wing butterfly with a vertical spread?
The butterfly generates income from time decay and a stable or moderately drifting underlying. The vertical spread is added as an actively-managed hedge (typically on the opposite side of the market from the butterfly's risk) to offset directional exposure as the underlying price moves during the trade's life.
What win rate is realistic for a BWB options strategy?
Based on this 58-trade, nearly 4-year dataset, an actively managed BWB + vertical strategy on SPX produced an 89.7% win rate. High win rates are typical of credit-based, defined-risk structures like this one, but they come with the trade-off that the occasional loss is meaningfully larger than the typical win, so win rate alone doesn't determine profitability; the win/loss size ratio matters just as much.
Is a broken-wing butterfly strategy safe during market crashes or shocks?
No defined-risk options strategy is immune to sharp, fast directional moves. In this dataset, the two largest losses both occurred during a single volatility event (the April 2025 tariff-driven selloff), which shows that BWB strategies are most vulnerable to sudden, high-velocity moves; as opposed to slower trending or range-bound markets, where the structure performed consistently well across multiple years.
Conclusion
Four years of trade data make the case for the SPX broken-wing butterfly plus vertical approach as a high-win-rate, actively managed income strategy rather than a "set and forget" credit spread. The 89.7% win rate and ~5.0× profit factor are the result of two things working together: a structure that's built to collect a credit in most market conditions, and a discipline of actively rolling the vertical hedge (or the BWB) as SPX moves rather than letting the trade sit static until expiration. The average losses run roughly twice the size of average wins, and the strategy's two worst trades both came from the same kind of event: a fast, news-driven selloff that moved faster than the hedge could be adjusted. For a trader evaluating this approach, the practical takeaway isn't "this strategy doesn't lose"; it's that the strategy is well-suited to grinding or moderately trending markets, recovers quickly after a drawdown, and demands real attention during periods of acute macro risk, when the gap between a manageable adjustment and a -$3,000+ trade can come down to days, not weeks.
Methodology
This analysis is based on a complete trade-by-trade log of 58 closed SPX options trades, recorded with execution dates, strikes, lot sizes, and per-leg trade costs, covering June 2022 through March 2026. P&L for each cycle reflects the sum of all opening and closing transactions tied to that expiration, including all intra-cycle vertical adjustments.
Want to go deeper on the mechanics behind these 58 trades?
This analysis, made with Claude on our SPX Best trade history, is for informational and educational purposes only and does not constitute financial or investment advice. Options trading involves substantial risk and is not suitable for all investors. Past performance does not guarantee future results.